Tag: Asset Management

  • Scheduled Time or Calendar Time, and Which One to Defend 

    Scheduled Time or Calendar Time, and Which One to Defend 

    Once you have sized your hidden plant, the first challenge you get will be about the denominator. It is a fair challenge and you should have the answer ready, because the two available answers are both correct and they serve different audiences. 

    Against scheduled time 

    This measures the hours you staffed, powered, and paid for. Weekends you did not run, shifts you did not staff, and planned shutdowns are excluded. 

    It is the plant manager’s number. It is fair to the crew, because it only counts time the plant asked the asset to produce. It is defensible on the floor, because nobody can argue that you are charging them for hours the business chose not to schedule. And it is the right basis for the case you are going to build, because the action you will propose operates inside scheduled time. 

    On our packaging line, that number is $10.5mm a year. 

    Against calendar time 

    This measures the asset you actually bought, all 8,760 hours of it. 

    It is the capital committee’s number. It answers a different question: how much of the equipment on the balance sheet is producing margin, and how much capacity is available without buying new steel. It is the number a private equity buyer runs during diligence, and it is the number that competes directly with a capital request for additional capacity. 

    It is always larger, sometimes dramatically so, and it is uncomfortable in a way that is occasionally productive. 

    Why the choice matters more than the arithmetic 

    Use the wrong one in the wrong room and you lose the room. 

    Put the calendar time figure in front of a crew that has been working hard and you have told them, in effect, that their best week was a fraction of what it should have been. It reads as an accusation regardless of your intent, and the honest counting you are about to ask them for will not happen. 

    Put the scheduled time figure in front of a capital committee that is weighing a new line and you have understated your own case, because the committee is deciding about the asset, not about the shift schedule. 

    The rule is simple. Build the case on scheduled time. Keep the calendar time number in your pocket for the capital conversation, and produce it only when someone proposes buying capacity you may already own. 

    The reflex this is aimed at 

    When demand rises, the reflex is a capital request. New line, new packer, new building. The business case is straightforward, the approval path is well worn, and the request moves quickly because everyone involved knows how to evaluate it. 

    Meanwhile the hidden plant sits inside assets already on the balance sheet. It requires no capital approval, no installation window, no ramp up curve, and no additional floor space. And it produces nothing, because nobody has sized it and therefore nobody has proposed it. 

    The question worth putting in front of leadership is not whether to add capacity. It is whether to collect the capacity already purchased before purchasing more. That question has never been asked in most plants, and it is not asked because the number required to ask it does not exist. 

    The objection you will get 

    “We cannot sell everything we make.” 

    This is the right challenge and it deserves a real answer, which is that recovered hours can be taken three ways. As volume, where they convert to margin at full value. As cost, by running fewer scheduled shifts for the same output and removing premium labor and utility hours from the base. Or as capacity held, where the hidden plant becomes a capital avoidance argument and the next line gets deferred by years. 

    The mistake is treating an unsellable hour as a free one. It is not free. It was paid for. 

    This week 

    Calculate both numbers. Present one. Know which room you are in. 

  • Your Plan Is Not Your Capacity 

    Your Plan Is Not Your Capacity 

    There is a plant somewhere this month that will beat plan by three percent, hold a short celebration, and leave $10mm of contribution margin on the floor. Nobody involved will do anything wrong. 

    The mechanism is the plan itself. 

    How the plan absorbs the losses 

    Production plans get built from history, because history is the most defensible input available to a planner. Last year’s actual output becomes this year’s baseline, adjusted for demand, mix, and known changes. Nobody would design it differently, and as a scheduling instrument it works. 

    The problem is what history contains. Last year’s actuals already include last year’s unplanned stops, last year’s slow running, last year’s long changeovers, and last year’s rework. All of it is priced into the baseline as if it were a property of the asset rather than a set of losses that could be recovered. 

    So the losses get inherited, and then they get hidden, because once they are inside the plan they stop being losses and start being the plan. 

    Beat it and you are performing. Miss it and you are underperforming. In neither case does anyone ask the question that finds the money: what was the asset capable of? 

    The two plants 

    It is easier to hold if you think of it as two plants operating in the same building. 

    The visible plant is what you shipped. It is measured, reported, budgeted, forecast, and rewarded. Everything about it is well governed, and it is the plant your P&L describes. 

    The hidden plant is the output you already have every resource to produce and are not producing. Fully staffed, fully powered, fully supplied, fully paid for, and not collected. It has no reporting, no owner, and no line in the budget. 

    The hidden margin is the money trapped in the second plant. It is contribution margin that the fixed cost base has already been paid to produce. 

    That last point is what makes this an executive conversation rather than a maintenance one. You are not proposing to spend money to create capacity. You are proposing to collect capacity you have already bought. 

    What it looks like in numbers 

    Back to the packaging line. Case packer constraint, 600 bags per hour design rate, 417 scheduled hours in the month, $10 contribution margin per bag. 

    Design output at scheduled time: 250,000 bags. 

    Actual good output: 162,500 bags. 

    Hidden plant: 87,500 bags per month. 

    At $10 per bag, that is $875,000 a month, or $10.5mm a year, on one asset. 

    Last week the same asset produced a $1.5mm figure when measured against plan. The plan was concealing a factor of seven. 

    Note what this figure is measured against. Scheduled time only. It excludes weekends and unstaffed shifts entirely, which is what makes it fair to the crew and defensible on the floor. 

    The word that matters is hidden 

    Not lost. Not wasted. Not broken. 

    Hidden means already owned and not collected, and that is a fundamentally different conversation to have with a CFO. Lost capacity sounds like an accusation. Uncollected capacity sounds like an asset, which is exactly what it is, sitting on a balance sheet you are already depreciating. 

    This week 

    Take your asset. Find its design rate, confirm it against the best sustained rate you have documented evidence for, and use the lower figure. Count scheduled hours for one representative month. Multiply. Subtract actual good output. Multiply the gap by contribution margin. 

    Then resist the urge to soften the answer. 

  • Size Your Hidden Plant in Twenty Minutes 

    Size Your Hidden Plant in Twenty Minutes 

    This is the whole calculation. It takes longer to schedule the meeting about it than to do it. 

    The four inputs 

    1. Design rate. Units per hour the asset was built to produce. Start with the nameplate or the original equipment documentation. 

    2. Scheduled hours. Hours in a representative month that the plant asked this asset to produce. Exclude unstaffed shifts and planned shutdowns. 

    3. Actual good output. Units in that same month that were saleable. Good output, not gross output. Anything reworked or scrapped consumed a constraint hour you cannot resell. 

    4. Contribution margin per unit. Price less variable cost, sourced from finance in writing. 

    The arithmetic 

    Design rate times scheduled hours gives design output. 

    Design output less actual good output gives the hidden plant in units. 

    Hidden plant units times contribution margin gives your hidden margin. 

    For our packaging line: 600 bags per hour times 417 hours is 250,000 bags. Less 162,500 actual gives 87,500 bags. At $10 per bag, $875,000 a month, $10.5mm a year, one asset. 

    When the design rate is a problem 

    This is where most people stall, so here is how to handle each case. 

    The nameplate is missing. Ask the original equipment manufacturer, who will usually have it against the serial number. Failing that, use the best sustained rate the asset has actually demonstrated, documented from a production log rather than from memory. 

    The nameplate is obviously inflated. Common, particularly where the asset was specified for a different product or package format than it now runs. Use the best sustained demonstrated rate instead and note the substitution in your assumptions. 

    Nobody agrees on it. Ask two people who have run the asset at its best what it does on a good day. Take the lower figure. You are not trying to win an argument about the ceiling. You are trying to establish a number that survives challenge, and the conservative version does that better. 

    The principle throughout: a defensible number you can hold beats an ambitious number you have to retreat from. Every point you concede on the design rate makes the remaining figure harder to dismiss. 

    Write down your assumptions as you go 

    Four lines is enough. 

    Design rate, and where it came from. Scheduled hours, and what you excluded. Actual good output, and whether it is good or gross. Contribution margin, and who at finance provided it. 

    Those four lines are what turn your figure from an opinion into a calculation. The first person who challenges the number will challenge one of them, and having the answer ready is what ends the challenge rather than starting a debate. 

    Expect it to feel too big 

    It will. Nearly everyone’s first reaction to their own hidden plant figure is that it must be wrong, because a number that size would surely have been noticed. 

    It has not been noticed because nothing in the reporting system was built to notice it. The P&L cannot see uncollected capacity. The plan has already absorbed the losses. OEE, where it is tracked at all, is frequently reported as a percentage without ever being converted into money. 

    Do not shrink the number to make it comfortable. Test it, which is exactly what the next two weeks are for. If your counted losses land within about ten percent of your calculated gap, the number was right. 

    Your twenty minutes 

    Run the four inputs. Write the four assumption lines. Put the result in one sentence: this asset gives away X dollars of contribution margin per year at current performance. 

    Then carry that sentence into next week, where we start finding out where the hours actually went.

  • Your P&L Cannot See a Lost Hour 

    Your P&L Cannot See a Lost Hour 

    There is a reason smart executives look at complete, accurate financial statements every month and still cannot find the largest margin opportunity in the building. The statements are not wrong. They are answering a different question. 

    What happens to an hour that never ran 

    By the time production reaches the P&L, output has been converted into cost of goods sold, absorbed overhead, and variance. Every one of those figures describes what was produced. 

    The hours that were not produced have no representation. There is no line called capacity not collected. There is no variance account for the four hundred bags the case packer could have run during the shift it spent waiting on a changeover that took longer than it should have. 

    The only trace those hours leave is indirect. Fixed cost spread across fewer units raises absorbed cost per unit, which shows up next quarter as unit cost creep. In the review meeting, that gets discussed as inflation, supplier pricing, or product mix. It is occasionally all three. It is also, quite often, hours. 

    Why the plan makes it worse 

    The plan is the second layer of concealment, and it is well intentioned. 

    Plans are built from history, because history is the most defensible input available. Last year’s actuals become this year’s baseline, adjusted for demand and known changes. That is a reasonable way to run a scheduling function. 

    It is a terrible way to measure capacity. Every loss embedded in last year’s performance gets inherited into this year’s plan and then hidden by it. Beat the plan and the plant is congratulated. Nobody asks what the asset was capable of, because the plan has quietly become the answer to that question. 

    So you end up with a plant that looks efficient against a target that was set by its own historical losses. 

    The question that finds the money 

    Stop asking whether the plant hit plan. Ask this instead: 

    How many units did this asset have every resource to produce, and how many did it produce? 

    Every word in that sentence is doing work. Every resource means staffed, powered, supplied, and scheduled. It excludes the shifts you did not staff. It is a fair question, answerable from data you already own, and it produces a number the P&L will never give you. 

    On the packaging line we have been using, the answer is uncomfortable. At 600 bags per hour design rate across 417 scheduled hours in the month, the asset had every resource to produce 250,000 bags. It produced 162,500. 

    The gap to plan was 12,500 bags and $125,000. The gap to what the asset could actually do is 87,500 bags and $875,000 for the month. Same asset, same month, same data, and a number roughly seven times larger. 

    Two ledgers, one plant 

    It helps to think of it as two sets of books that never reconcile. 

    The financial ledger records what you shipped and what it cost. It is audited, governed, and correct. It is also complete only with respect to transactions that occurred. 

    The capacity ledger records what the assets could have delivered and did not. Nobody keeps it. It is not audited because it is not written down. And it holds the larger of the two numbers in most manufacturing plants. 

    You do not need to replace the first ledger. You need to start keeping the second one, on one asset, for one month. 

    What to do this week 

    Take the asset you picked on Monday. Find its design rate from the nameplate or the original equipment documentation, then confirm it against the best sustained rate anyone remembers running. Use the lower of the two, because a conservative number you can defend beats an ambitious one you cannot. 

    Multiply design rate by scheduled hours. Subtract actual good output. Multiply by contribution margin. 

    Expect the result to feel too large. Do not shrink it to feel comfortable. Test it instead. 

  • The Number Your Plant Missed Last Month, and Nobody Could Price It 

    The Number Your Plant Missed Last Month, and Nobody Could Price It 

    Last month your plant made money. It also missed the plan. Both of those things are on the same report, and if you walked into the morning meeting and asked what the miss was worth in contribution margin, you would most likely get silence, followed by three explanations, none of which carries a dollar sign. 

    That silence is worth about $1.5mm a year on a single asset. Here is how that number gets built. 

    The three explanations that never survive a follow up question 

    “We had a rough month.” This describes the result, not the cause. It cannot be sized, compared against last quarter, or attached to an action. It is a summary of the thing you were trying to explain. 

    “The equipment is old.” Age is not a loss category. Two identical assets, purchased the same year, installed on the same site, routinely run twenty points apart. If age were the cause, that would not happen. 

    “We are short people.” Sometimes true and usually incomplete. It rarely explains why the same crew delivered plan the month before with the same headcount. 

    None of these are dishonest. They are what capable people say when nobody has given them a counting system. The failure here is structural, not personal. 

    Why the number matters more than the excuse 

    Consider a packaging line with a case packer as the constraint. The plan for the month was 175,000 bags. Actual good output was 162,500. The gap is 12,500 bags. 

    Contribution margin on that product is $10 per bag, which is price less variable cost. Not gross margin, not revenue. Contribution margin, because the fixed cost base gets paid whether the line runs or not, so the full margin on recovered volume drops to the bottom line. 

    12,500 bags at $10 is $125,000 for the month. Annualized, that is $1.5mm on one asset. 

    That figure did not require new instrumentation, a software purchase, or a consultant. It required plan, actual, and one number from finance. 

    And here is the part worth sitting with: $1.5mm is the small number. It is the gap to a plan that was already discounted to what the line has been doing. The gap to what the asset can actually produce is considerably larger, and we will get to that. 

    Unmeasured margin never gets funded 

    This is the mechanism that keeps the money on the floor. 

    Finance cannot approve a number that does not exist. A capital committee is not hostile to reliability work, it is simply comparing proposals, and the proposal that arrives with a documented figure beats the one that arrives with a conviction. Capital flows toward the best documented problem, not the biggest one. 

    So the plant that describes its losses qualitatively competes for funding against a plant that describes them in dollars, and loses every time, regardless of which one actually has the larger opportunity. 

    Sizing the loss is not an accounting exercise you do after the improvement work. It is the first act of leadership on the problem, and it is what makes everything downstream possible. 

    What to do this week 

    Pick one asset. The one that sets the pace, where a stop stops the shipment. Pull plan against actual good output for the last eight weeks. Ask finance for contribution margin per unit, in writing, even if it is just an email. 

    Multiply the gap by the margin. Write the answer as one sentence with a dollar sign in it. 

    That sentence is a better management tool than any dashboard you will be sold this year, and it costs you fifteen minutes. 

  • Pick One Asset. Just One. 

    Pick One Asset. Just One. 

    Most efforts to quantify plant losses fail in week two, and the cause is almost always the same. Somebody decides that if one asset is worth measuring, the whole line is worth measuring, and by the end of the month there are eleven partial data sets and no defensible number. 

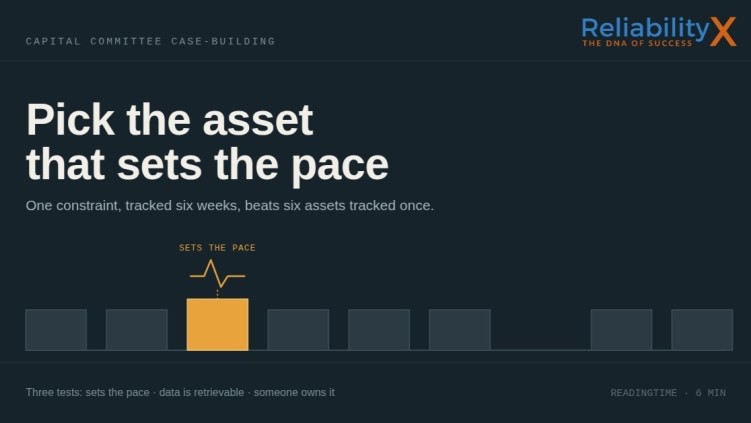
    One asset, followed for six weeks, produces a case you can take to a capital committee. Six assets, followed for six weeks, produce a spreadsheet nobody trusts. 

    Here is how to choose the one. 

    Test 1: It sets the pace 

    When this asset stops, does the line stop and does the shipment move? 

    That is the whole test. If output upstream of the asset simply accumulates and gets processed later, you have found a busy asset, not a constraint. Recovering an hour there costs you the same effort and returns nothing to the plant, because the hour was never the limiting factor. 

    The constraint is usually obvious to the people who run the line and frequently invisible in reporting. Ask two operators and a supervisor where the line backs up. They will agree, and they will be right. 

    A caution: the constraint moves. Product mix, seasonal demand, and a maintenance backlog can all shift it. For a six week exercise, pick the asset that is the constraint most of the time and stay with it. Chasing a moving constraint week to week is how the effort dies. 

    Test 2: You can get the data 

    You need run time and output for at least eight weeks of history, plus the ability to observe the asset for two weeks going forward. 

    Perfect data is not the standard. Retrievable data is. A production log in a binder is enough. A shift handover sheet is enough. If the asset is instrumented and you can export it, that is faster, but nothing here requires it. 

    If the data does not exist in any form, that is itself a finding worth reporting, and it usually means picking a different asset for this first pass rather than starting a data collection project you will not finish. 

    Test 3: Somebody owns it 

    There has to be a named person, an operator, a planner, or a supervisor, who can actually change something about how the asset runs. 

    This is the test people skip, and it is the one that determines whether your number turns into money. An asset nobody owns produces an interesting figure, a good slide, and no change at all. When the analysis is done, someone has to be able to act on it without waiting for a reorganization. 

    Write it down and say it out loud 

    Once you have chosen, commit publicly. Tell your plant manager which asset you are following and why. Put the name in an email. 

    This sounds like a small thing. It is the difference between an exercise that survives the first busy week and one that quietly stops. Named commitments get kept. 

    Your fifteen minutes this weekend 

    1. Name the asset. 
    1. Pull plan against actual good output for the last eight weeks. 
    1. Email finance and ask for contribution margin per unit, which is price less variable cost. If they push back, that conversation is itself worth having, because a finance blessed margin figure is nearly impossible to attack later. 
    1. Multiply the eight week gap by the margin. 
    1. Write the result as one sentence. 

    You now have one asset and one dollar figure, which is more than most plants have, and it is the input for everything that follows.

  • Reliability Engineering: The Strategic Advantage Behind Every High-Performing Asset

    Reliability Engineering: The Strategic Advantage Behind Every High-Performing Asset

    In asset-intensive industries, keeping equipment running efficiently, safely, and cost-effectively is a top priority. Reliability engineering plays a crucial role in achieving this goal by ensuring that assets are designed, maintained, and operated to minimize failures and maximize performance. 

    A strong reliability engineering program helps organizations reduce downtime, lower maintenance costs, enhance safety, and extend asset life. Whether in manufacturing, energy, transportation, or utilities, companies that invest in reliability engineering gain a competitive advantage by improving operational efficiency and asset performance. 

    What is Reliability Engineering? 

    Reliability engineering is a systematic approach to improving the dependability of assets and systems. It focuses on identifying, analyzing, and mitigating failure risks throughout an asset’s lifecycle—from design and procurement to operation and maintenance. 

    The goal of reliability engineering is to maximize asset availability and performance while minimizing unplanned failures, repair costs, and risks. 

    Key Responsibilities of a Reliability Engineer 

    A reliability engineer works to: 

    • Identify failure modes and their root causes. 
    • Implement predictive and preventive maintenance strategies. 
    • Optimize asset lifecycle management for long-term reliability. 
    • Use data-driven analysis to improve asset performance. 
    • Ensure compliance with safety and regulatory requirements. 

    By applying engineering principles, data analytics, and advanced maintenance techniques, reliability engineers help organizations achieve higher equipment uptime and operational efficiency. 

    Why is Reliability Engineering Important? 

    1. Reducing Unplanned Downtime

    Equipment failures lead to costly production stoppages, missed deadlines, and lost revenue. Reliability engineering helps prevent unexpected breakdowns by identifying weaknesses before they become critical failures. 

    Techniques like Failure Mode and Effects Analysis (FMEA) and Root Cause Analysis (RCA) allow organizations to: 

    • Predict potential failure points. 
    • Address reliability issues before they lead to downtime. 
    • Improve overall equipment effectiveness (OEE). 
    1. Lowering Maintenance Costs

    Reactive maintenance—waiting for assets to fail before repairing them—is expensive and inefficient. Reliability engineering promotes proactive maintenance strategies, such as: 

    • Preventive Maintenance (PM) – Scheduled maintenance tasks to reduce failure risks. 
    • Predictive Maintenance (PdM) – Using real-time condition monitoring to predict failures. 
    • Reliability-Centered Maintenance (RCM) – Optimizing maintenance strategies based on failure risks and asset criticality. 

    These approaches help organizations reduce repair costs, minimize labor expenses, and extend asset life. 

    1. Improving Safety and Compliance

    Unreliable equipment increases the risk of accidents, environmental hazards, and regulatory violations. Reliability engineering helps organizations: 

    • Ensure safer working conditions by reducing equipment failures. 
    • Comply with industry standards and regulations (e.g., ISO 55000 for asset management). 
    • Minimize environmental risks associated with equipment malfunctions. 

    A well-structured reliability program protects both employees and assets, ensuring compliance with industry best practices. 

    1. Enhancing Asset Performance and Efficiency

    High-performing assets drive higher productivity and lower operational costs. Reliability engineering optimizes: 

    • Mean Time Between Failures (MTBF) – Increasing the time between failures. 
    • Mean Time to Repair (MTTR) – Reducing the time needed to restore assets. 
    • Overall Equipment Effectiveness (OEE) – Improving asset availability, performance, and quality. 

    By applying data analytics and machine learning, reliability engineers can track trends, predict failures, and optimize asset utilization. 

    Key Reliability Engineering Tools and Techniques 

    1. Failure Mode and Effects Analysis (FMEA)

    FMEA is a proactive method used to: 

    • Identify potential failure modes. 
    • Assess their impact on operations. 
    • Develop strategies to eliminate or mitigate failure risks. 
    1. Root Cause Analysis (RCA)

    RCA helps reliability engineers investigate and eliminate the true causes of failures, preventing recurrence. 

    1. Predictive Maintenance (PdM)

    Using condition monitoring technologies like vibration analysis, thermal imaging, and oil analysis, organizations can: 

    • Detect early signs of failure. 
    • Schedule maintenance only when needed. 
    • Reduce unnecessary downtime and costs. 
    1. Reliability-Centered Maintenance (RCM)

    RCM focuses on prioritizing maintenance efforts based on asset criticality, failure consequences, and operational impact. This method helps organizations balance maintenance costs with reliability goals. 

    1. Digital Twin and AI-Powered Analytics

    Advanced reliability engineering leverages digital twins (virtual replicas of assets) and AI-driven analytics to: 

    • Simulate real-world asset behavior. 
    • Optimize maintenance decisions. 
    • Predict failures with high accuracy. 

    Implementing a Reliability Engineering Program 

    1. Establish Reliability Goals

    Define key performance indicators (KPIs) such as MTBF, MTTR, and asset availability to measure reliability success. 

    1. Collect and Analyze Asset Data

    Use CMMS, IoT sensors, and historical maintenance records to gain data-driven insights into asset performance and failure patterns. 

    1. Implement Condition Monitoring Technologies

    Adopt predictive maintenance tools like vibration analysis, infrared thermography, and AI-driven diagnostics to enhance failure prediction accuracy. 

    1. Optimize Maintenance Strategies

    Use RCM, FMEA, and reliability analysis to develop cost-effective maintenance plans that balance performance, risk, and cost. 

    1. Foster a Reliability-Centered Culture

    Train employees on reliability best practices and encourage a proactive, data-driven approach to asset management. 

    Conclusion 

    Reliability engineering is essential for organizations that depend on physical assets to drive operations. By proactively managing asset performance, implementing advanced maintenance strategies, and leveraging predictive analytics, businesses can significantly reduce downtime, lower costs, and improve safety. 

    Investing in a strong reliability engineering program ensures that assets operate at peak performance, delivering long-term value and competitive advantage in today’s demanding industrial landscape. 


  • Design for Reliability: Building Assets to Last

    Design for Reliability: Building Assets to Last

    In asset-intensive industries, the reliability of equipment and systems is a critical factor in ensuring operational efficiency, safety, and cost-effectiveness. While maintenance and repairs are essential for sustaining asset performance, the most cost-effective approach to reliability starts at the design phase. This concept, known as Design for Reliability (DfR), ensures that assets are engineered to be robust, durable, and capable of meeting performance expectations throughout their lifecycle. 

    By integrating reliability principles into the initial design and engineering stages, organizations can reduce unplanned downtime, lower maintenance costs, and enhance overall asset performance. 

    What is Design for Reliability (DfR)? 

    Design for Reliability (DfR) is a systematic approach to designing assets, equipment, and systems with reliability in mind. It involves incorporating failure prevention, predictive analytics, and maintainability principles into the engineering and development process. 

    Instead of reacting to failures after an asset is in operation, DfR ensures that potential failure modes are identified and mitigated before an asset is even built. 

    Why is Design for Reliability Important? 

    1. Reduces Lifecycle Costs

    Unreliable equipment leads to high maintenance costs, frequent breakdowns, and increased operational expenses. By designing assets with reliability in mind, organizations can: 

    • Reduce the need for costly repairs and emergency maintenance. 
    • Extend the useful life of assets, reducing capital expenditures. 
    • Minimize operational disruptions caused by unexpected failures. 


    1. Improves Equipment Availability and Performance

    Reliable design means that assets are more resilient and can operate for longer periods without failure. This results in: 

    • Higher uptime and productivity, as assets remain operational longer. 
    • Optimized performance, reducing variability in output. 
    • Lower spare parts consumption, as equipment wears out less frequently
       
    1. Enhances Safety and Compliance

    Asset failures can lead to safety hazards, environmental risks, and regulatory violations. A well-designed, reliable system ensures: 

    • Safer working conditions by reducing unexpected failures. 
    • Compliance with industry standards and regulations, such as ISO 55000 for asset management. 
    • Lower risk of catastrophic failures, protecting both people and the environment.
       
    1. Supports Sustainable Operations

    Reliability-driven design minimizes waste and energy consumption, leading to: 

    • Lower carbon footprint due to reduced material and energy use. 
    • Fewer replacements and less waste, supporting sustainability initiatives. 
    • Improved efficiency, reducing emissions and resource consumption. 

    Key Principles of Design for Reliability 

    1. Failure Mode and Effects Analysis (FMEA)

    FMEA is a proactive method used in DfR to identify potential failure modes, their causes, and their effects on system performance. It helps engineers: 

    • Recognize design weaknesses before production. 
    • Implement design changes to mitigate failure risks. 
    • Prioritize failure modes based on severity, occurrence, and detection. 
    1. Redundancy and Resilience

    Reliable systems are designed with redundant components to ensure continued operation even if one part fails. This can include: 

    • Backup power systems for critical equipment. 
    • Dual-pump configurations in fluid systems. 
    • Parallel processing units to prevent system-wide failures. 
    1. Predictive Maintenance Integration

    By incorporating condition monitoring technologies like IoT sensors, vibration analysis, and thermal imaging, assets can be designed to support predictive maintenance strategies. This allows for: 

    • Early detection of performance degradation. 
    • Scheduled interventions before failures occur. 
    • Reduced reliance on reactive maintenance approaches. 
    1. Standardization and Modularity

    Designing assets with interchangeable and standardized components makes maintenance easier and more cost-effective. This approach: 

    • Simplifies repairs by reducing the variety of parts needed. 
    • Ensures faster replacements, minimizing downtime. 
    • Improves supply chain efficiency by using common parts across multiple systems. 
    1. Ease of Maintenance (Maintainability)

    Good design considers how easily an asset can be inspected, repaired, and maintained. Key aspects include: 

    • Accessible components, reducing time spent on repairs. 
    • User-friendly interfaces, allowing operators to monitor performance easily. 
    • Simplified assembly and disassembly, enabling faster servicing. 

    Implementing Design for Reliability in Your Organization 

    1. Involve Reliability Engineers Early

    Reliability should be a core design consideration from the beginning, not an afterthought. Having reliability engineers involved in the design process ensures: 

    • Potential failure points are identified early. 
    • Design decisions prioritize longevity and durability. 
    • Maintenance and operability are considered before production. 
    1. Use Data to Drive Design Improvements

    Leveraging historical failure data, performance metrics, and real-world case studies can help improve designs. Organizations can use: 

    • Failure reports and maintenance records to identify common issues. 
    • Digital twins to simulate real-world performance before deployment. 
    • Machine learning and AI to predict design weaknesses. 
    1. Test and Validate Designs

    Prototype testing under real-world conditions helps verify that assets meet reliability expectations. Testing methods include: 

    • Accelerated life testing, simulating years of wear in a short time. 
    • Environmental stress testing, exposing assets to extreme conditions. 
    • Reliability growth testing, ensuring continuous design improvements. 

    Conclusion 

    Design for Reliability (DfR) is a proactive approach to building durable, high-performance assets that require minimal maintenance and deliver long-term value. By integrating reliability principles into the design phase, organizations can significantly reduce downtime, lower costs, improve safety, and optimize asset performance. 

    In today’s competitive and asset-dependent industries, companies that prioritize reliability at the design stage will gain a significant advantage, ensuring their equipment and systems remain productive and efficient for years to come. 


  • Workforce Management: The Key to Effective Asset Management

    Workforce Management: The Key to Effective Asset Management

    In asset-intensive industries, workforce management is just as critical as the physical assets themselves. No matter how advanced an organization’s maintenance strategies, asset monitoring systems, or predictive technologies are, the success of asset management depends on the people who operate, maintain, and optimize those assets. 

    Workforce management in relation to asset management is about ensuring that the right people, with the right skills, are in the right place at the right time to keep assets running efficiently and reliably. A well-managed workforce leads to higher productivity, lower costs, improved safety, and extended asset lifespan. 

    The Connection Between Workforce and Asset Management 

    Asset management involves optimizing the lifecycle of physical assets to maximize performance and minimize costs. But achieving this goal requires a skilled, well-coordinated workforce capable of performing the right tasks efficiently. Workforce management focuses on planning, scheduling, training, and resource allocation to ensure that maintenance teams operate at peak efficiency. 

    Without a strategic approach to workforce management, organizations may face challenges such as: 

    • Labor shortages affecting maintenance schedules. 
    • Skills gaps preventing effective asset maintenance. 
    • Inefficient scheduling, leading to increased downtime. 
    • High turnover, impacting reliability and asset care. 

    Addressing these challenges through proactive workforce management strengthens the overall asset management strategy. 

    Key Aspects of Workforce Management in Asset Management 

    1. Workforce Planning and Scheduling

    Effective workforce planning ensures that maintenance teams have the right number of skilled personnel to meet asset management goals. This involves: 

    • Forecasting workforce needs based on asset maintenance schedules and operational demands. 
    • Allocating the right personnel to high-priority assets. 
    • Using data-driven scheduling tools to optimize work order assignments. 

    Advanced Computerized Maintenance Management Systems (CMMS) or Enterprise Asset Management (EAM) software can automate scheduling, ensuring that technicians are assigned based on skills, availability, and priority. 

    1. Skills Development and Training

    With the increasing complexity of modern assets, maintenance teams need continuous training to stay effective. Organizations must invest in: 

    • Technical training on asset-specific maintenance and troubleshooting. 
    • Digital literacy training for using advanced maintenance technologies like IoT, AI, and predictive analytics. 
    • Safety training to reduce workplace risks. 

    A workforce with strong technical competencies ensures that assets are maintained efficiently, reducing failures and extending equipment lifespan. 

    1. Workforce Productivity and Performance Monitoring

    Measuring workforce performance is crucial in asset management. Organizations can track: 

    • Mean Time to Repair (MTTR) – How quickly technicians restore assets. 
    • First-time Fix Rate (FTFR) – The percentage of maintenance tasks completed correctly on the first attempt. 
    • Work order completion rates – Ensuring maintenance teams stay on schedule. 

    Using CMMS dashboards and real-time performance metrics, managers can identify areas for improvement and optimize workforce utilization. 

    1. Retention and Knowledge Management

    The retirement of experienced maintenance professionals is a growing concern in asset management. To prevent knowledge loss, organizations should: 

    • Implement mentorship programs for younger technicians. 
    • Document maintenance procedures in CMMS or digital knowledge bases. 
    • Use predictive analytics and AI to capture best practices for asset care. 

    Ensuring knowledge transfer between experienced workers and new hires maintains operational efficiency and asset reliability. 

    1. Contractor and Vendor Management

    Many organizations rely on external contractors for specialized asset maintenance tasks. Managing contractors effectively involves: 

    • Setting clear performance expectations and SLAs (Service Level Agreements). 
    • Tracking contractor work quality using CMMS data. 
    • Ensuring compliance with safety and asset management standards. 

    An integrated workforce strategy includes both internal teams and external contractors, ensuring seamless asset care. 

    Technology’s Role in Workforce and Asset Management 

    Digital tools like CMMS, EAM, and AI-powered scheduling software play a crucial role in workforce management. They help: 

    • Optimize workforce allocation based on real-time asset data. 
    • Automate maintenance planning to prevent unexpected downtime. 
    • Enable mobile workforce management, allowing technicians to receive and update work orders remotely. 

    By leveraging technology, organizations can improve workforce efficiency while reducing maintenance costs. 

    Conclusion 

    Workforce management is the backbone of effective asset management. Organizations that prioritize training, scheduling, performance tracking, and knowledge transfer create a maintenance workforce that maximizes asset reliability, reduces costs, and enhances operational efficiency. 

    By integrating smart workforce strategies with advanced asset management technologies, businesses can achieve long-term success, ensuring that their assets—and the people who manage them—are performing at their best. 


  • Understanding Asset Portfolio Management in Asset Management 

    Understanding Asset Portfolio Management in Asset Management 

    Understanding Asset Portfolio Management in Asset Management 

    In the world of asset management, the concept of an asset portfolio is crucial. Organizations that rely on physical assets—whether in manufacturing, energy, transportation, or utilities—must manage them strategically to maximize value, minimize risk, and ensure long-term sustainability. Just as investors manage a financial portfolio to balance risk and return, businesses must manage their asset portfolio to align with operational and financial goals. 

    What is an Asset Portfolio? 

    An asset portfolio refers to the collection of physical assets that an organization owns and operates. This includes everything from buildings, machinery, and vehicles to infrastructure and technology systems. Managing these assets as a portfolio rather than as standalone items enables organizations to make informed, strategic decisions about investments, maintenance, and asset lifecycle management. 

    Asset portfolio management is a key component of enterprise asset management (EAM) and helps organizations optimize asset performance while ensuring alignment with business objectives. 

    Why is Asset Portfolio Management Important? 

    1. Strategic Decision-Making

    A well-managed asset portfolio enables organizations to prioritize investments based on the criticality of assets, risk exposure, and financial impact. Not all assets are equally important—some directly impact production or service delivery, while others are secondary. 

    By categorizing assets into a portfolio framework, organizations can: 

    • Identify which assets require immediate attention (e.g., aging infrastructure or high-failure equipment). 
    • Determine which assets should be upgraded, replaced, or decommissioned. 
    • Balance short-term maintenance costs with long-term capital investments. 
    1. Risk Management and Resilience

    Managing assets as a portfolio allows organizations to evaluate and mitigate risks. This includes: 

    • Asset failure risks – Identifying high-risk assets that could cause operational disruptions. 
    • Regulatory risks – Ensuring compliance with safety and environmental regulations. 
    • Financial risks – Avoiding unexpected expenses due to poor asset performance or premature failures. 

    By implementing predictive maintenance and condition monitoring, organizations can proactively address risks and prevent costly breakdowns. 

    1. Lifecycle Cost Optimization

    Every asset has a lifecycle, from acquisition and operation to maintenance and disposal. An effective asset portfolio strategy ensures that organizations: 

    • Extend asset life through proactive maintenance. 
    • Minimize total cost of ownership (TCO) by balancing maintenance, energy, and operational costs. 
    • Optimize capital expenditures by replacing assets at the right time to avoid unnecessary spending. 

    For example, a manufacturing company might find that upgrading to energy-efficient machinery reduces long-term operational costs, even if the initial capital investment is high. 

    1. Performance Monitoring and Data-Driven Insights

    A data-driven approach to asset portfolio management helps organizations track key performance indicators (KPIs) such as: 

    • Asset utilization rates. 
    • Maintenance costs vs. asset value. 
    • Downtime and reliability statistics. 

    Leveraging a Computerized Maintenance Management System (CMMS) or Enterprise Asset Management (EAM) software, organizations can gain real-time insights into asset performance and make better investment decisions. 

    1. Sustainability and Environmental Impact

    As businesses face increasing pressure to reduce their carbon footprint, asset portfolio management plays a key role in sustainability efforts. Organizations can: 

    • Identify high-energy-consuming assets and replace them with greener alternatives. 
    • Implement recycling and waste reduction strategies for asset disposal. 
    • Ensure compliance with environmental regulations and industry standards. 

    By integrating sustainability goals into asset portfolio management, companies improve efficiency while reducing their environmental impact. 

    How to Implement an Effective Asset Portfolio Strategy 

    1. Categorize Assets by Criticality – Determine which assets are mission-critical vs. non-essential, allowing for better prioritization of resources. 
    2. Evaluate Asset Condition and Performance – Use data from maintenance records, IoT sensors, and inspections to assess which assets need repairs, upgrades, or replacements. 
    3. Align Asset Management with Business Goals – Ensure asset decisions support broader corporate objectives, such as cost reduction, reliability improvement, or sustainability initiatives. 
    4. Leverage Technology for Portfolio Optimization – Implement EAM and CMMS solutions to collect, analyze, and manage asset data efficiently. 
    5. Continuously Review and Adjust the Portfolio – Asset needs change over time, so organizations must regularly assess and optimize their asset portfolio strategy. 

    Conclusion 

    Managing an asset portfolio is not just about maintaining individual assets—it’s about taking a holistic, strategic approach to maximize the value, efficiency, and longevity of all assets within an organization. A well-structured asset portfolio strategy improves decision-making, reduces risks, controls costs, and aligns asset management with overall business objectives. 

    By leveraging technology, data analytics, and proactive maintenance practices, organizations can transform asset management into a competitive advantage—ensuring long-term success and sustainability in an ever-evolving business landscape.

    Need help building your strategy? Reach out at localhost/RX-Revamp/contact