Most maturity assessments hand back a number and a colored chart. This one hands back the order of work: which of 40 areas to fix, in what sequence, and what each one is worth to your site.
Two real areas from one site, one assessment. Both scored 62 out of 100. A single rating puts them in the same amber bucket, and they are not the same problem or the same size of prize.
MM-FLM · Maintenance management
Failure management
Okay results, held back by a gap
62/100Opportunity18.8
KUnderstanding2.4gap
EWritten way of working4.4exemplary
DConsistency1.6gap
RMethod4.4not yet assessable
ResResults2.8weak
The method scores 4.4 and is not credited. How sound it is cannot be judged while the practice is not being followed.
What it is. A well written practice that the people doing the work do not understand and do not follow the same way twice. The procedure is not the problem.
First move
Train the people who do the work, in short hands-on sessions out where the job happens. Then have a supervisor spend a few minutes a day watching the work, not the paperwork.
OR-DEF · Operational reliability
Defect elimination
Good result, but resting on gaps
62/100Opportunity3.7
KUnderstanding2.0gap
EWritten way of working1.6gap
DConsistency3.6solid
RMethod4.0not yet assessable
ResResults4.4exemplary
Strong results, with nothing written down behind them. The outcome depends on who is on shift.
What it is. A habit that works, held up by a handful of people. There is no agreed method on paper and no owner, so the result can drop the week those people move on.
First move
Train the people, then agree how this is done and put it on one page with a named owner. Record what is producing the result today so it becomes normal practice rather than one person's knack.
18.8 vs 3.7
Same 62 out of 100. Five times the opportunity on the left, because the site's own people rate failure management as far easier to move and a little more valuable. A ranked score sheet would have sent the budget to the wrong one.
02
Spend where the return is, not where the chart is red.
The lowest score is rarely the best investment. Every area carries a value and an effort rating from your own people, so the work comes back in the order that pays.
01
Ranked by payback, not by score
Opportunity is what your team says the area is worth, multiplied by how easy they say it is to move, applied to the distance from target. A poor score in an area nobody values and nobody can move is not where the money goes.
02
Root first, so the fix holds
Every area returns its most basic gap first. Buying a system or writing another procedure does not stick when the real gap is that nobody understands the work. That is where reliability budgets get spent twice.
03
Nothing credited that cannot be verified
A good result sitting on inconsistent execution is flagged unverified rather than banked, and a sound-looking method is not scored as sound until it is actually being followed. It stops you declaring a win and moving the crew somewhere else.
04
Movement you can prove next year
Same questions, same roles, same scale, same math. The second assessment measures change against the first rather than the opinion of whoever ran it.
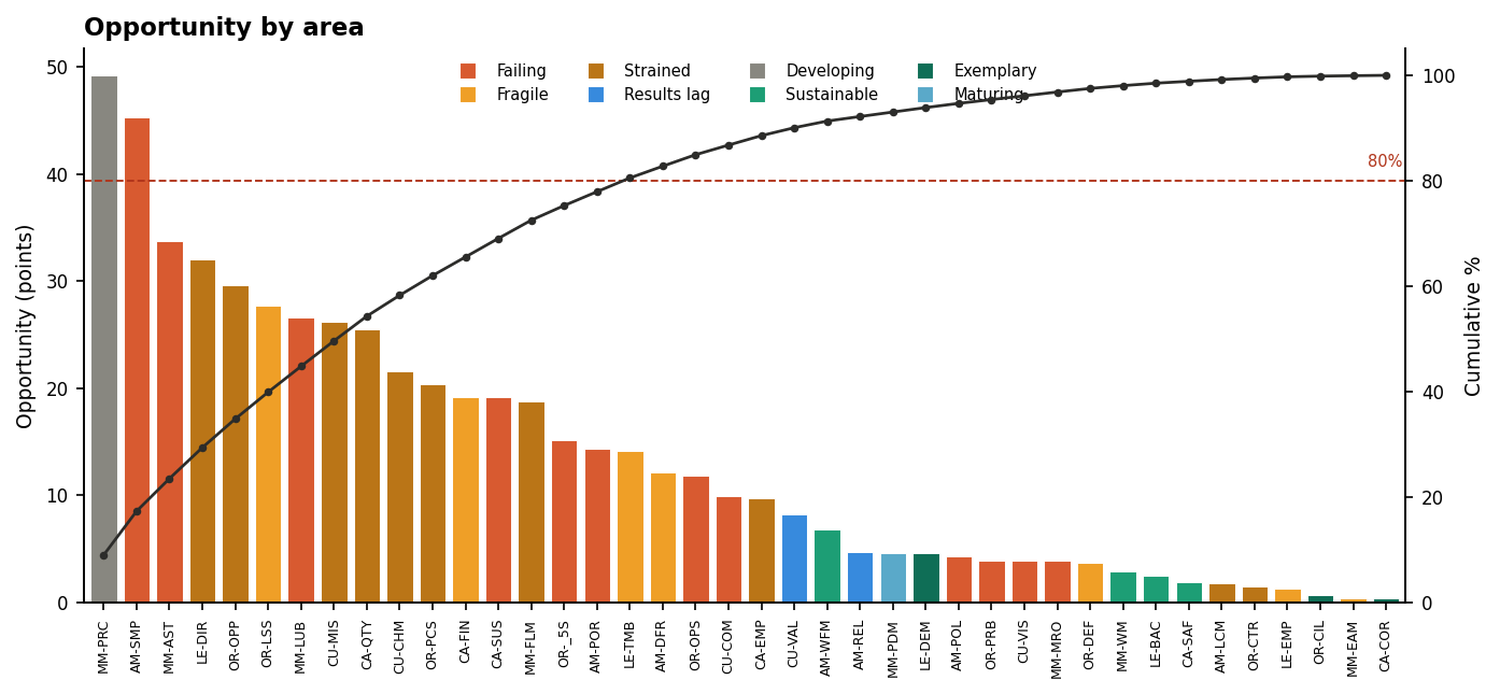
9 of 40On this site, nine areas held half of the total opportunity and seventeen held eighty percent. The remaining twenty three are real, but they are not where this year's money goes. That is the difference between a plan and a list.
Turning the sequence into EBITDA
Opportunity points order the work; they do not price it. Run the assessment alongside a full line loss analysis and the two halves meet: the loss analysis puts a number on what each loss is costing you, and the assessment says which practice gaps are letting those losses persist and in what order to close them. That pairing is what moves EBITDA, rather than just moving a score.
Sample assessment from a demonstration site.
03
What makes this one different.
Six differences that change what lands on your desk at the end of it.
Typical maturity assessment
This assessment
What comes back
A score and a colored chart
A diagnosis: what is wrong, why it is wrong, and the first move
How an area is read
One overall rating
Five layers, read in the order that decides whether a fix holds
What sets the order of work
Lowest score first
Value and effort as your own team ranks them, against the gap
A good result on weak execution
Counts, and gets celebrated
Flagged unverified until execution is consistent
Who is asked
One workshop, usually leadership
Five roles across the site answer the same 200 questions
The improvement plan
Quoted as the next engagement
Already in the report, for all 40 areas
04
Four steps, and you keep the result.
01
Survey
Five roles across the site answer the same 200 questions, plus a short ranking of which areas matter most and which are easiest to move. Everyone is asked, not just the room that shows up.
02
Score
Each of the 40 areas is scored on all five layers, then rolled into an area score, a score for each of the six parts of the business, and one overall maturity band.
03
Diagnose
Every area lands in one of 48 situations, from working well to a good result on a hollow foundation. Each is explained in plain language, in terms that fit the area.
04
Improve
You get the sequence of work, ranked by return, with the first move written for every area. Run it again later and the movement is measurable.
05
Two ways to run it, one report either way.
Same 40 areas, same five layers, same report. What changes is how the input is gathered and how much observation goes with it.
On site
Guided, with observation
Four weeks end to end. Pre-work data gathering and coordination before anyone travels. One week on site for interviews across the roles and plant floor walks, so what the assessment is told can be checked against what the floor actually shows. Then two weeks to draft and finalize the report and the strategy that goes with it.
Self-directed
Survey links, automated report
Survey links go out to your team and everyone answers in their own time. The report is generated automatically from the responses and comes back on the same 40 areas, scored the same way, with the same first moves. No travel, no scheduling, no shutdown. What it cannot do is watch the work, so it reads what your people report rather than what an assessor sees on the floor.
06
A report your team can act on without a translator.
Written for the people at the site, in the language of the area being described, not in the language of the assessor.
Overall maturity band, plus a score for each of the six parts of the business
All 40 areas ranked by opportunity, so the order of work is settled
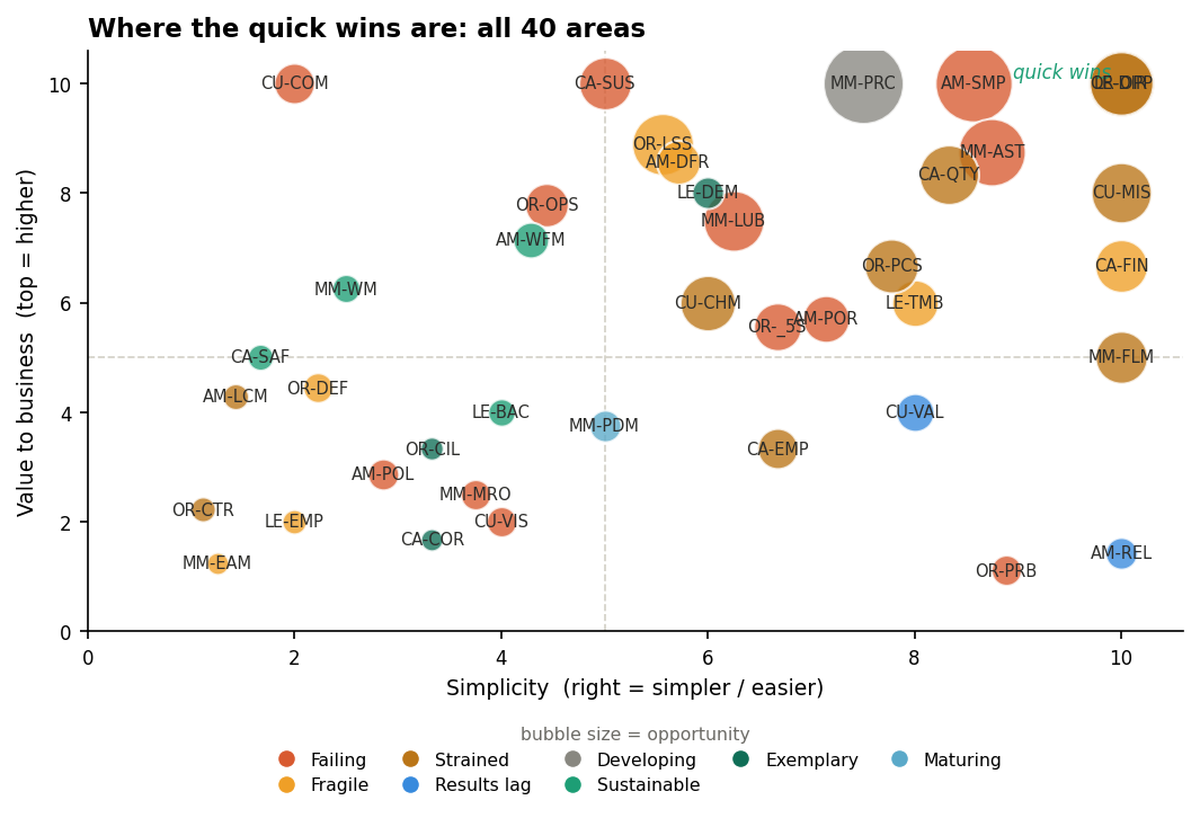
A value and effort map per domain, with the quick wins in the top right
One card per area: the situation, the five-layer readout, a plain-language explanation, and the first move
A re-runnable baseline, so next year measures movement rather than opinion
From the report, word for word
The good numbers hold for now, but they stand on effort, not on anything built to last. Keep the result safe while you build the missing pieces.
Defect elimination · 62 out of 100
Quick winsEvery area placed by value to the business and by how easy your team says it is. High value and easy sits top right, and bubble size is the size of the prize. All 40 areas are shown.
Find out which nine areas hold half your opportunity.
Tell us about the site and we will walk you through both options, the survey window, and what the report looks like when it lands.