Category: Leadership

  • The Number Your Plant Missed Last Month, and Nobody Could Price It 

    The Number Your Plant Missed Last Month, and Nobody Could Price It 

    Last month your plant made money. It also missed the plan. Both of those things are on the same report, and if you walked into the morning meeting and asked what the miss was worth in contribution margin, you would most likely get silence, followed by three explanations, none of which carries a dollar sign. 

    That silence is worth about $1.5mm a year on a single asset. Here is how that number gets built. 

    The three explanations that never survive a follow up question 

    “We had a rough month.” This describes the result, not the cause. It cannot be sized, compared against last quarter, or attached to an action. It is a summary of the thing you were trying to explain. 

    “The equipment is old.” Age is not a loss category. Two identical assets, purchased the same year, installed on the same site, routinely run twenty points apart. If age were the cause, that would not happen. 

    “We are short people.” Sometimes true and usually incomplete. It rarely explains why the same crew delivered plan the month before with the same headcount. 

    None of these are dishonest. They are what capable people say when nobody has given them a counting system. The failure here is structural, not personal. 

    Why the number matters more than the excuse 

    Consider a packaging line with a case packer as the constraint. The plan for the month was 175,000 bags. Actual good output was 162,500. The gap is 12,500 bags. 

    Contribution margin on that product is $10 per bag, which is price less variable cost. Not gross margin, not revenue. Contribution margin, because the fixed cost base gets paid whether the line runs or not, so the full margin on recovered volume drops to the bottom line. 

    12,500 bags at $10 is $125,000 for the month. Annualized, that is $1.5mm on one asset. 

    That figure did not require new instrumentation, a software purchase, or a consultant. It required plan, actual, and one number from finance. 

    And here is the part worth sitting with: $1.5mm is the small number. It is the gap to a plan that was already discounted to what the line has been doing. The gap to what the asset can actually produce is considerably larger, and we will get to that. 

    Unmeasured margin never gets funded 

    This is the mechanism that keeps the money on the floor. 

    Finance cannot approve a number that does not exist. A capital committee is not hostile to reliability work, it is simply comparing proposals, and the proposal that arrives with a documented figure beats the one that arrives with a conviction. Capital flows toward the best documented problem, not the biggest one. 

    So the plant that describes its losses qualitatively competes for funding against a plant that describes them in dollars, and loses every time, regardless of which one actually has the larger opportunity. 

    Sizing the loss is not an accounting exercise you do after the improvement work. It is the first act of leadership on the problem, and it is what makes everything downstream possible. 

    What to do this week 

    Pick one asset. The one that sets the pace, where a stop stops the shipment. Pull plan against actual good output for the last eight weeks. Ask finance for contribution margin per unit, in writing, even if it is just an email. 

    Multiply the gap by the margin. Write the answer as one sentence with a dollar sign in it. 

    That sentence is a better management tool than any dashboard you will be sold this year, and it costs you fifteen minutes. 
  • Pick One Asset. Just One. 

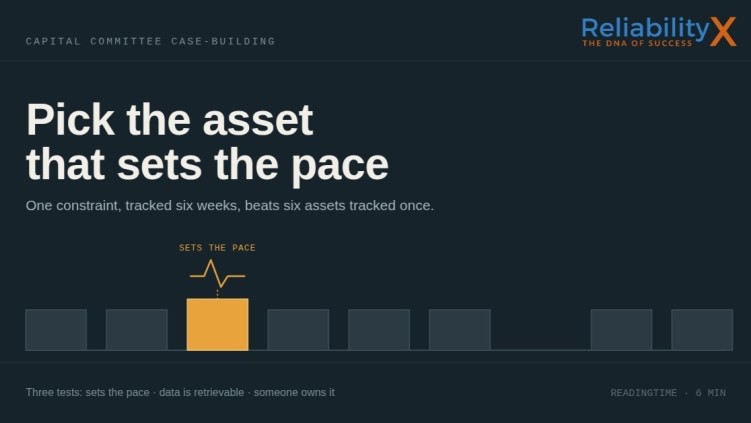
    Pick One Asset. Just One. 

    Most efforts to quantify plant losses fail in week two, and the cause is almost always the same. Somebody decides that if one asset is worth measuring, the whole line is worth measuring, and by the end of the month there are eleven partial data sets and no defensible number. 

    One asset, followed for six weeks, produces a case you can take to a capital committee. Six assets, followed for six weeks, produce a spreadsheet nobody trusts. 

    Here is how to choose the one. 

    Test 1: It sets the pace 

    When this asset stops, does the line stop and does the shipment move? 

    That is the whole test. If output upstream of the asset simply accumulates and gets processed later, you have found a busy asset, not a constraint. Recovering an hour there costs you the same effort and returns nothing to the plant, because the hour was never the limiting factor. 

    The constraint is usually obvious to the people who run the line and frequently invisible in reporting. Ask two operators and a supervisor where the line backs up. They will agree, and they will be right. 

    A caution: the constraint moves. Product mix, seasonal demand, and a maintenance backlog can all shift it. For a six week exercise, pick the asset that is the constraint most of the time and stay with it. Chasing a moving constraint week to week is how the effort dies. 

    Test 2: You can get the data 

    You need run time and output for at least eight weeks of history, plus the ability to observe the asset for two weeks going forward. 

    Perfect data is not the standard. Retrievable data is. A production log in a binder is enough. A shift handover sheet is enough. If the asset is instrumented and you can export it, that is faster, but nothing here requires it. 

    If the data does not exist in any form, that is itself a finding worth reporting, and it usually means picking a different asset for this first pass rather than starting a data collection project you will not finish. 

    Test 3: Somebody owns it 

    There has to be a named person, an operator, a planner, or a supervisor, who can actually change something about how the asset runs. 

    This is the test people skip, and it is the one that determines whether your number turns into money. An asset nobody owns produces an interesting figure, a good slide, and no change at all. When the analysis is done, someone has to be able to act on it without waiting for a reorganization. 

    Write it down and say it out loud 

    Once you have chosen, commit publicly. Tell your plant manager which asset you are following and why. Put the name in an email. 

    This sounds like a small thing. It is the difference between an exercise that survives the first busy week and one that quietly stops. Named commitments get kept. 

    Your fifteen minutes this weekend 

    1. Name the asset. 
    1. Pull plan against actual good output for the last eight weeks. 
    1. Email finance and ask for contribution margin per unit, which is price less variable cost. If they push back, that conversation is itself worth having, because a finance blessed margin figure is nearly impossible to attack later. 
    1. Multiply the eight week gap by the margin. 
    1. Write the result as one sentence. 

    You now have one asset and one dollar figure, which is more than most plants have, and it is the input for everything that follows.

  • Business Acumen: Cost-Benefit Analysis 

    Business Acumen: Cost-Benefit Analysis 

    If you can’t turn the loss into a number, the project won’t get funded. Here’s how you turn it. 

    Cost-Benefit Analysis 

    You’ve found the loss, sized it, and picked your target. Now you have to ask for money, and that means building a case. The most common tool for deciding whether a project is worth doing is the Cost-Benefit Analysis, and the good news is the math is simple. The hard part isn’t arithmetic. It’s being honest about both sides of the ledger. 

    A Cost-Benefit Analysis weighs the benefits, the gains and savings, against the costs, the spend and investment, required to get them. The goal is to answer two questions: is this project worth doing, and how fast does it pay back? 

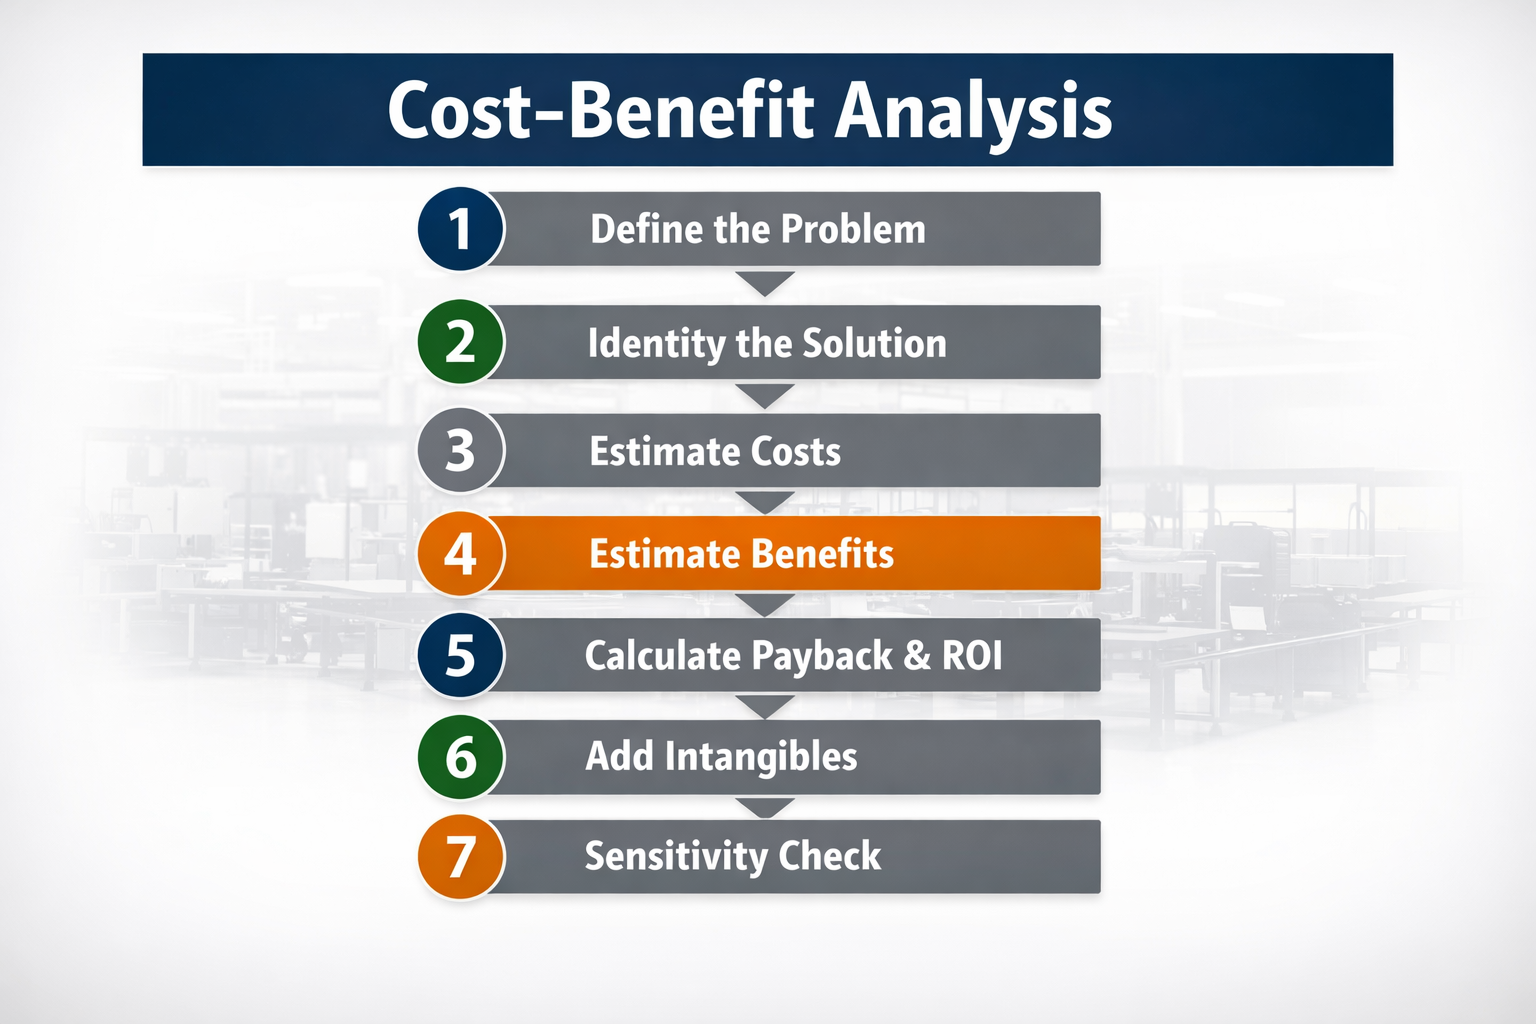
    Here’s the whole process in seven steps. Not seventy. Seven. 

    Step 1: Define the problem or opportunity 

    Be specific. Vague problems attract vague solutions and zero dollars. 

    • Weak: “The packaging line breaks down a lot.” 
    • Strong: “Unplanned downtime on the packaging line averages 8 hours a month, costing $24,000 a month in lost contribution.” 

    The difference between those two sentences is the difference between a complaint and a business case. 

    Step 2: Identify the solution 

    Propose a specific intervention with a scope, a timeline, and an owner. For example: precision alignment and balancing training for the six mechanics, plus a laser alignment tool kit. Concrete enough that someone could actually approve and schedule it. 

    Step 3: Estimate all the costs 

    All of them, not just the obvious capital number. The hidden ones are what sink projects after approval, when the real bill comes in higher than the pitch. 

    • Capital cost, such as equipment and tools. 
    • Labor, including training time, install labor, and project management. 
    • Materials and consumables. 
    • Lost production during install or startup. 
    • Ongoing costs, such as software licenses, maintenance, and recalibration. 

    Step 4: Estimate all the benefits 

    List both kinds, but only put the hard ones in the math. 

    Benefit type  Examples 
    Hard (use in the math)  Reduced downtime hours, less scrap and rework, less overtime, energy savings, longer asset life 
    Soft (mention, don’t count)  Improved morale, safer work, fewer customer complaints, less firefighting, easier hiring and retention 

    The discipline of using only hard dollars in the calculation is what makes your number credible upstairs. Soft benefits are real, but the moment you count them in the math, a skeptical CFO stops trusting the whole case. 

    Step 5: Calculate payback and ROI 

    Payback Period = Total Cost / Annual Benefit 

    ROI % = ((Annual Benefit – Annual Cost) / Total Cost) x 100 

    Step 6: Add the intangibles, separately 

    List the soft benefits on their own. They don’t change the math, but they tip close calls and they matter in the leadership conversation. Just keep them clearly out of the numbers. 

    Step 7: Run a sensitivity check 

    Ask the obvious “what if” questions before someone else does: 

    • What if the downtime savings come in at only half what we projected? 
    • What if costs run 20% over? 
    • What if it takes twice as long to implement? 

    If the project still wins under reasonable downside assumptions, you have a solid case. If it only works when everything goes perfectly, you don’t. 

    Real-world example: a precision alignment program. Problem: 8 hours a month of downtime tied to bearing failures, misalignment, and vibration. At $3,000 an hour in contribution, that’s $24,000 a month, or $288,000 a year. 

    Solution: laser alignment tools, training, and precision standards. 

    Costs: alignment tools $15,000, training for six mechanics $10,000, implementation labor $5,000. Total cost $30,000. 

    Benefits: six fewer downtime hours a month at $18,000 a month is $216,000 a year, plus $6,000 a year from extended bearing life and $4,000 a year from fewer rebuilds. Total benefit $226,000 a year. 

    The math: payback is $30,000 / $226,000, about six to seven weeks. ROI is (($226,000 – $30,000) / $30,000) x 100, which is 653%. 

    Verdict: invest immediately. 

    A case like that doesn’t get debated. It gets approved, because every number in it is hard, conservative, and traceable. 

    Try it yourself 

    Pick a project off your wish list and build the CBA in seven lines: 

    • Problem statement, with the dollar value of the current loss. 
    • Solution. 
    • Total cost, all in. 
    • Annual benefit, hard dollars only. 
    • Payback period. 
    • ROI percentage. 
    • Sensitivity: does it still win if the benefit is only half? 

    If you can’t fill in that first line with a real dollar number, that’s your homework before you go any further. 

    Key takeaways 

    • CBA is seven steps, not seventy. Keep it simple. 
    • Include all costs, not just the obvious capital. Hidden costs are what sink projects after approval. 
    • Use only hard benefits in the math. Mention the soft ones separately. 
    • Always sensitivity-check at half the projected benefit. If it still wins, your case is strong. 

    Coming next, Part 4, Post 2: ROI, Payback, NPV, and BCR Made Simple.

    If you are ready to turn your improvement ideas into funded projects, ReliabilityX can help. Our team works directly with your data to build clear, defensible business cases that leadership approves with confidence.

    Contact us to schedule a review of your plant and learn how to translate reliability improvements into measurable financial results.

  • Business Acumen: Where to Focus First

    Business Acumen: Where to Focus First

    You can’t fix all 30 losses at once. Even the best plants pick two or three a year. This is how you choose. 

    By now you can name the losses and size them in dollars. That creates a new and better problem: you can suddenly see more opportunity than you could possibly chase. So the skill that matters now isn’t finding losses. It’s choosing which ones to attack first. 

    The 80/20 pattern shows up here too 

    On any given line, about 80% of the loss is usually packed into just two or three of the 30 buckets. You don’t need a program that boils the ocean. You need to find those two or three in your specific plant, then match the right fix to each. Everything else can wait. 

    Three questions, in order 

    When you’re deciding where to point your effort, ask these in sequence: 

    • Which loss is biggest in dollars? Not hours. Dollars. And as you’ll see in a moment, an hour on the bottleneck is worth far more than an hour anywhere else. 
    • What will the fix cost? Capital, labor, and organizational change all count. 
    • How fast will it land? Quick wins matter more than they look, because they build the credibility that gets your slower, bigger projects approved. 

    Match the strategy to the loss 

    A breakdown is not fixed the same way as a speed loss. One of the most common mistakes is applying a single favorite tool to every problem. Here’s the rough mapping: 

    Loss type  Best strategy 
    Breakdowns  Asset strategy optimization, reliability engineering, root cause analysis, precision maintenance, lubrication management 
    Process Failures  Process engineering, design improvements, operator training 
    Setup and Adjustments  Standardized procedures, centerline management, training, discipline 
    Speed Losses  Defect elimination, line condition, materials handling improvements 
    Minor Stops  Operator care routines, incoming material specs, centerlining, workplace organization 
    Startup Defects  Structured changeover reduction, centerline standards, PM effectiveness 
    In-Process Defects  Process control monitoring, in-process checks, supplier quality, operator training 

    The bottleneck rule, and why it changes everything 

    This is the single most important idea in the post. 

    An hour saved on the bottleneck is an hour of brand-new throughput. An hour saved anywhere else is just less idle time on a machine that was never the constraint. 

    The bottleneck is the slowest step in the chain, the one that sets the pace for everything downstream of it. Always find it before you decide where to invest. The implications are blunt: 

    • Cut breakdowns on a non-bottleneck, and your total output may not move at all. 
    • Cut minor stops on the bottleneck, and every hour you save flows straight to shipments. 

    Real-world example: the same hour, two different outcomes. A snack-foods plant runs a slicer (1,200 lb/hr) feeding a fryer (1,000 lb/hr) feeding a packaging line (950 lb/hr). The bottleneck is the packaging line at 950 lb/hr, because it’s the slowest step. Now watch two equally hard engineering projects: reducing slicer breakdowns by 50% produces exactly $0 of new revenue, because the slicer was never the constraint. Reducing packaging-line minor stops by 30% directly increases shipments. Same effort, completely different financial result. Always start at the bottleneck. 

    Quick wins versus long plays 

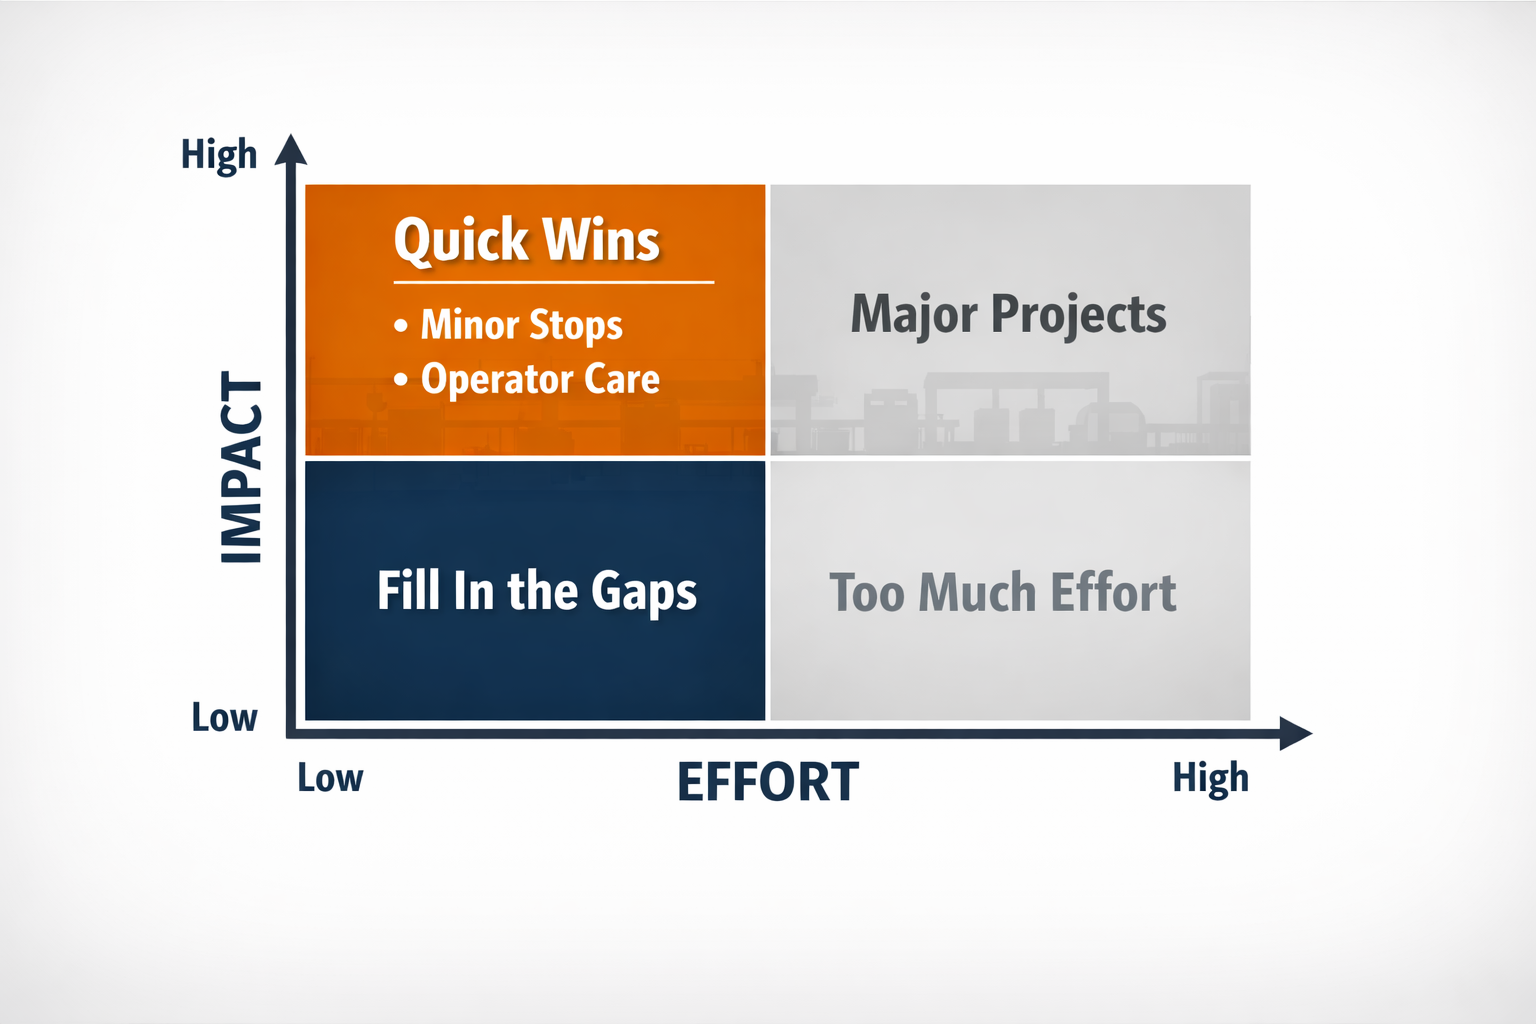
    Sort your candidate projects on a simple grid of impact against effort. 

      Low effort  High effort 
    High impact  Do first. These quick wins build credibility.  Plan. These are your major projects. 
    Low impact  Do if easy. Fill in the gaps.  Avoid. Not worth the cycles. 

    On a typical line, the two corners look like this: 

    • Quick wins: operator care routines, kitting parts before PMs, centerline standards, basic changeover improvements, and knocking out the top five minor-stop causes. 
    • Long plays: a predictive maintenance program, machine redesigns, capital projects, and control system upgrades. 

    Try it yourself 

    Go back to the OEE calculation you ran in the last post: 

    • Identify your top three losses by hours. 
    • For each, multiply hours per week by your contribution margin to get dollars per week. 
    • Plot each one on the grid above using your gut feel for effort and impact. 
    • Pick the upper-left item as your first project. Pick the upper-right item as your annual goal. 

    Key takeaways 

    • Pick the two or three losses that hold 80% of your dollar opportunity, and ignore the rest for now. 
    • Match the strategy to the loss type. Breakdowns and speed losses are not solved the same way. 
    • An hour saved on the bottleneck is worth more than an hour saved anywhere else. Always. 
    • Quick wins build the credibility that funds the long plays. 

    Wrapping up Part 3 

    You’ve now closed the gap between naming a loss and sizing it. You can calculate where a line really stands, translate any loss into annual dollars, and choose the two or three targets that matter most, with the bottleneck rule keeping you honest about which hours actually count. 

    That’s everything you need to walk into a room with a number. What you need next is the language that turns a number into an approved project: payback, ROI, and the cost of doing nothing. That’s Part 4. 


    Coming next, Part 4: Building the Business Case. 

    If you are ready to identify the two or three losses that hold most of your opportunity, ReliabilityX can help. Our team works directly with your data to pinpoint the bottleneck, quantify the dollar impact, and design the strategy that delivers measurable results.

    Contact us to schedule a focused review of your plant and start turning hidden losses into recovered margin.

  • Business Acumen: The 10 Resource Losses

    Business Acumen: The 10 Resource Losses

    Equipment and labor losses cost you time. Resource losses cost you the stuff itself. And these are the ones Finance can already see. 

    Here’s why this last category is special. The equipment and human losses show up as time, and time has to be translated before Finance feels it. Resource losses skip the translation. They land straight in cost-per-unit and gross margin, which means they’re the losses your CFO is most likely to already believe. That makes them the easiest place to build a business case, and the rest of this series leans heavily on what you find here. 

    There are ten of them. 

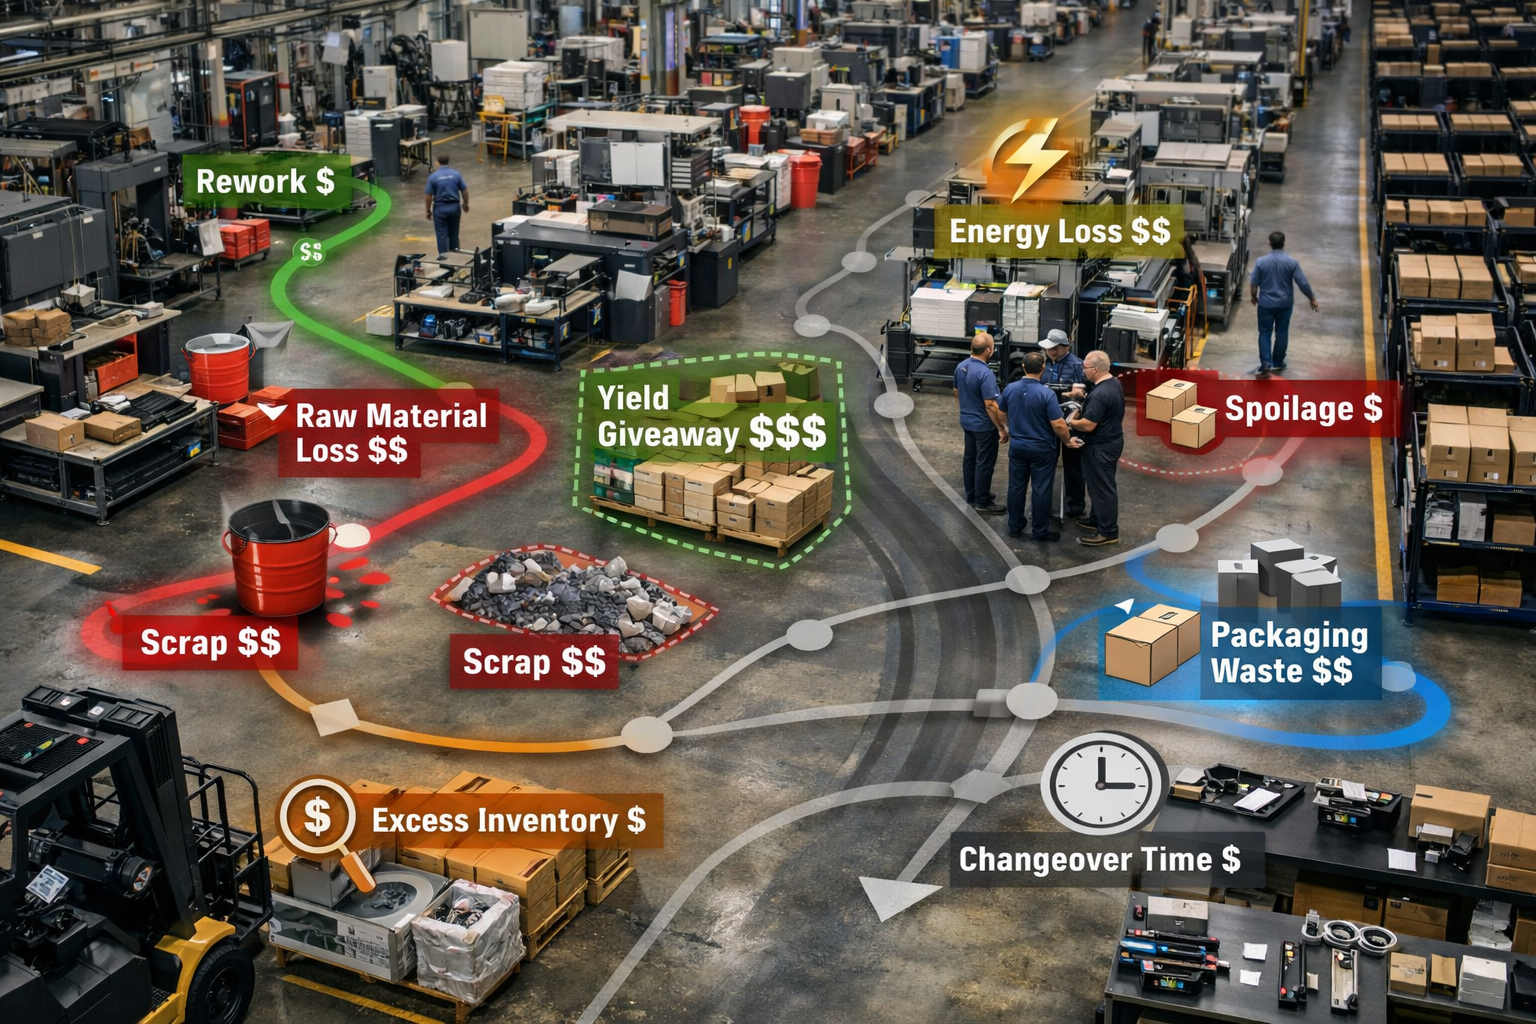
    1. Rework. Producing a unit that isn’t acceptable as-is but can be repaired and sold. It’s a triple cost: the original materials, the labor to redo it, and the line time you spent reworking instead of making something new. 
    1. Raw Material Losses. Material lost to leaks, loose specs, contamination, damage, and poor storage. This is the one most often shrugged off as “the cost of doing business,” yet it commonly runs 1% to 3% of total raw material spend, which is real money on any plant of size. 
    1. Scrap. Material consumed in conversion that can’t be sold as the primary product: trim, edges, mixing residue. Sometimes you recover it as regrind, sometimes you don’t, but either way it dilutes your yield. 
    1. Spoilage. Product so off-spec or damaged it can’t even be reworked. This is the most expensive loss of all, because both the material and every hour of labor invested in it drop to zero value. 
    1. Packaging Materials Losses. Film, boxes, labels, and cases lost to defects, poor storage, and equipment misalignment. Often 2% to 5% of packaging spend, and almost entirely invisible until someone audits it. 
    1. Excess Inventory Losses. Cash tied up in inventory you don’t actually need, usually from forecasting errors and “just in case” thinking. Every dollar parked there is a dollar not paying down debt or funding improvements, and the carrying cost alone typically runs 15% to 25% a year. 
    1. Energy Losses. Energy wasted to compressed-air and steam leaks, idle-running equipment, oversized motors, and missing shutdown protocols. Studies consistently find 20% to 30% of plant energy is recoverable. On a plant spending $5M a year on energy, that’s $1M to $1.5M walking out the door. 
    1. Yield Losses. Giving away product because nobody trusts the process to hold a tighter spec. The classic case: a two-pound spec consistently filled at 2.05 to 2.10 pounds because the line can’t be trusted to stay above 2.0. That extra fraction of a pound on every unit is pure giveaway. 
    1. Changeover Time Losses. Production lost during product changeovers, driven by untrained operators, missing parts, and steps run one after another that could run in parallel. A line running six changeovers a week at 90 minutes each loses nine hours a week. Cutting changeover time in half is often worth $1M to $2M a year on a single line. 
    1. Overspending. Paying more than necessary on maintenance, MRO, contractors, supplies, and energy. The big driver is reactive work: every $1 of reactive maintenance costs roughly three to five times what the same job costs when planned. A plant running 40% reactive is overspending dramatically against one running 10% reactive. 

    Real-world example: the yield giveaway nobody noticed. A bagged-snack plant fills a 6 oz bag at an average of 6.18 oz, just to be sure they never go under spec. Annual volume is 50 million bags. That 0.18 oz per bag, across 50 million bags, is 9 million ounces, or 562,500 pounds of product given away every year. At a finished cost of $1.40 a pound, that’s $787,500 of pure giveaway annually, money walking straight out the door. The fix, tighter process control with predictive checkweigher feedback, cost $120,000. Payback: under two months. 

    That example is the whole category in miniature. Nothing broke. Nobody got hurt. No alarm went off. The plant simply gave away three-quarters of a million dollars a year, politely, one bag at a time, until somebody finally measured it. 

    Try it yourself 

    Identify your top three resource losses by dollar value: 

    • Pull or estimate the annual spend for each candidate: rework, scrap, packaging waste, energy, MRO, and so on. 
    • For each, estimate what a 10% reduction would save. 
    • Rank them by dollar opportunity, not by which one is easiest to fix. 

    Keep that ranked list. It becomes the raw material for the first business case we build in Part 4. 

    Key takeaways 

    • Resource losses are usually invisible until audited, and once measured they’re almost always bigger than expected. 
    • Energy waste, MRO obsolescence, and yield giveaway are the three most under-investigated buckets in most plants. 
    • Rework, scrap, and spoilage tend to get reported. The other seven buckets often don’t. 
    • Resource losses connect directly to gross margin, so reducing them moves the financial statements faster than anything else on the floor. 

    Wrapping up Part 2 

    You now have the full map. Thirty places money leaks out of a plant, sorted into machines, people, and resources, and you can tell which family any given loss belongs to. That alone puts you ahead of most rooms, because you can stop arguing about whose department is to blame and start pointing at named, sizeable targets. 

    But naming a loss isn’t the same as sizing it. A target you can’t measure still won’t get funded. So next we turn the 30 losses into numbers a CFO can act on, starting with the two that summarize everything: OEE and TEEP. 


    Coming next, Part 3: Measuring What Matters. 

    If you want to see where your plant’s money is quietly leaking, start with the resource losses. They’re already visible in your financials. You just have to measure them. If you want help identifying and quantifying these losses inside your operation, reach out.

  • Business Acumen: The 9 Human Efficiency Losses

    Business Acumen: The 9 Human Efficiency Losses

    The equipment losses are about how the machines run. These are about how the people work. Same waterfall, completely different fix. 

    If the 11 equipment losses are where reliability work pays off, the 9 human efficiency losses are where it doesn’t. That’s the single most important thing to understand about this category: these losses mirror the equipment ones, but you don’t solve them with maintenance. You solve them with planning, organization, training, and better physical layout. Throw a reliability program at a planning problem and you’ll spend money fixing machines that were never the issue. 

    These nine split into three scheduled labor losses and six others. 

    The three scheduled labor losses 

    These are the labor side of your planned downtime. The equipment was supposed to be down; the question is whether the people were used well while it was. 

    1. Scheduled Maintenance Labor Losses. Maintenance labor sitting idle during planned windows. If your wrench-time during scheduled work is 35%, then two-thirds of your maintenance labor is non-productive even on a good, planned day. 
    1. Scheduled Engineering Labor Losses. Engineering labor wasted during planned project windows, usually from scope creep, unclear handoffs, or late parts and drawings. Engineering hours are among the most expensive in the plant, so wasting them hits your project capital costs directly. 
    1. Scheduled Operations Labor Losses. Operations labor lost during planned operations windows. Ten people standing around for a 15-minute handoff briefing is a real, recurring loss, every shift, forever. 

    The six other human efficiency losses 

    1. Management and Planning Losses. Wait time caused by poor planning of the work itself: waiting for materials, tools, instructions, permits, or for equipment to be released. This is the single biggest source of lost wrench-time in maintenance, and it’s almost always a symptom of a reactive culture rather than lazy people. 
    1. Operating Motion Losses. Inefficiency in how operators have to move: bending, stretching, walking to fetch parts, hunting for tools. The hidden cost here isn’t just slower work; it’s injury risk. Every workers-comp incident is six figures of direct cost plus the productivity and morale damage around it. 
    1. Line Organization Losses. Inefficiency from how the line is laid out and how the workload is balanced across stations. It shows up as the same operators always being overloaded while others sit idle, or as bottlenecks nobody can quite explain. 
    1. Logistics Losses. Time lost moving material around the plant: operators walking for parts, dollies waiting on forklifts, work backing up because the next station can’t accept it. A finished pallet that sits 20 minutes waiting for a forklift is 20 minutes of unnecessary tied-up product, plus a safety hazard. 
    1. Waiting Losses. Operators waiting on equipment, materials, instructions, or each other. Easy to spot, hard to act on. This is one of the most demoralizing losses there is, because idle time tells your people that nobody values their time. 
    1. Setup and Adjustment Labor Losses. The labor side of equipment setup and adjustment, where skilled people are tied up redoing work that should have been right the first time. It’s a doubled cost: the equipment is down, and high-skill labor is being burned on something that was preventable. 

    Real-world example: wrench-time on a reactive shift. A maintenance supervisor films a typical shift. Out of eight paid hours per technician: 

    • Actual wrench time on equipment: 2.1 hours. 
    • Walking to and from the parts crib: 1.4 hours. 
    • Looking for tools: 0.9 hours. 
    • Waiting for permits or for production to release equipment: 1.1 hours. 
    • Waiting for instructions or supervisor decisions: 0.6 hours. 
    • Breaks, meetings, and paperwork: 1.9 hours. 

    Wrench-time comes out to 26%. With proper planning and kitting, world-class crews hit 55% to 60%. Closing that gap means doing roughly twice the work with the same headcount. That, in one shift, is a Management and Planning Loss you can see and size. 

    Wrench-time is the canary 

    If you want one number that tells you whether your plant has a human efficiency problem, it’s wrench-time: the share of paid maintenance hours actually spent turning wrenches on equipment. A reactive plant runs around 25% to 35%. A well-planned plant runs 55% to 65%. That gap isn’t about working harder. It’s about whether the work was set up so people could do it. 

    Try it yourself 

    Pick one of these to put a rough dollar value on this week: 

    • Time spent waiting for parts across your last five work orders. 
    • Distance an operator walks on your busiest line in a single shift, roughly estimated. 
    • The number of times someone had to stop and ask a supervisor for a decision before they could keep working. 

    Each of these is a number, and each number has a cost. Try to attach one. 

    Key takeaways 

    • Human efficiency losses mirror the equipment losses, but the fix is planning, organization, and training, not maintenance. 
    • Wrench-time is the canary: a reactive plant runs 25% to 35%, a planned plant 55% to 65%. 
    • Operating motion and line organization losses are large but invisible. They surface as fatigue, injuries, and bottlenecks. 
    • Waiting losses crush morale. Fix them and engagement rises right alongside productivity. 


    Coming next, Part 2, Post 4: The 10 Resource Losses.

    If you want to understand where your labor hours are slipping away, start with one number this week. Measure it. Put a dollar value on it. When you can see the loss, you can recover it. If you want help quantifying these losses inside your plant, reach out and we will walk you through the first assessment.

  • Business Acumen: The 11 Equipment Losses

    Business Acumen: The 11 Equipment Losses

    The 11 Equipment Losses 

    The machines are talking. Most plants only hear the loudest one. 

    In the last post we named the three families of loss. Now we go into the first and most familiar one: the 11 ways your equipment quietly hands money back. Familiar is the trap here. Most plants chase the loud, visible losses and walk right past the bigger, quieter ones. By the end of this post you’ll know all eleven by name, and you’ll know which ones are probably costing you the most. 

    The 11 equipment losses split into two groups: four are scheduled, and seven are unplanned. Both cost money. The scheduled ones are necessary, but necessary is not the same as efficient. 

    The four scheduled losses 

    These are the planned reasons you take a line down. You can’t eliminate them, but you can absolutely tighten them. 

    1. Scheduled Maintenance Time. Planned downtime for PMs, lubrication routes, inspections, and calibrations. The loss isn’t the PM; it’s the slop around it. A four-hour PM that runs six because parts weren’t staged just bled you two hours for nothing. 
    1. Scheduled Engineering Time. Planned downtime for installs, upgrades, and line modifications. A poorly scoped install that creeps from two days to five delays your return to production and burns labor the whole time. 
    1. Scheduled Operations Time. Planned downtime for inventory counts, training, cleanings, and audits. Stretching a two-hour training into a lost six-hour shift because nothing else was organized around it is pure waste. 
    1. Lack of Demand. The line isn’t scheduled because there are no orders. That’s not the plant’s fault, but the fixed-cost meter still runs during idle hours. Using that time well, for extra PMs, training, or projects, is the plant’s opportunity. 

    Real-world example: the PM that ran long. A four-hour planned PM on a packaging line took seven hours. The wrong gasket was kitted, costing 30 minutes to source the right one. Two technicians showed up without the right calibration tool, costing 45 minutes. Startup defects after restart threw away 90 minutes of product. The PM itself was fine. The planning around it was not. That extra three hours cost about $9,000 in lost contribution, and a 30-minute pre-PM kitting check would have prevented most of it. 

    The seven big losses 

    These are the seven unplanned losses you have the most control over, and they’re the ones that move OEE the most. This is where most reliability programs focus, and rightly so. 

    1. Setup and Adjustments. Deviation from a set standard of time. For example, a scheduled 30-minute changeover takes 45 minutes. The 15 minutes that was unplanned cost you units, equating to profit lost.  
    1. Breakdowns. Unplanned stops of 10 minutes or more that need a part to fix. This is the most visible loss, which is exactly why it gets too much of the attention. A single major breakdown can wipe out a week of contribution margin on a critical line. 
    1. Process Failures. Unplanned stops of 10 minutes or more that do not need a part: sensor faults, software glitches, control logic, operator confusion. These get missed because they don’t look like classic breakdowns, but they burn just as much time and often force a quality check on whatever ran before the stop. 
    1. Speed Losses. The gap between design speed and actual run speed. This is the most insidious loss in the building. A line built for 100 units a minute that runs at 80 has lost 20% of its capacity, and not one minute of it shows up on a downtime sheet. 
    1. Minor Stops. Stops under 10 minutes. Death by a thousand cuts. Two hundred short stops of three minutes each add up to 10 hours of downtime a week, invisible on the dashboard because no single event is big enough to notice. 
    1. Startup Defects. Defective product made during warm-up after a stop or changeover. Most plants accept this as “just how it is.” It isn’t. Reducing startup waste is one of the highest-return quality plays available. 
    1. In-Process Defects. Defective product made during normal running. This is a direct hit to material and labor cost, because a defective unit carries the full cost of being produced and generates exactly zero revenue. 

    Real-world example: the minor stops nobody sees. On a frozen-meal packaging line, the operator hits reset about 100 times a shift to clear minor jams from a tray feeder. Each reset takes 90 seconds. That’s 150 minutes per shift, two and a half hours of downtime, every shift, never logged because each event is under 10 minutes. At $4,200 an hour in lost contribution, that’s $10,500 per shift, or about $7.5M a year across three shifts. The fix was a $14,000 redesign of the tray-feed transfer. Payback: less than one day. 

    Read those two examples back-to-back and you can see the lesson. The loud loss, the breakdown, gets a war room. The quiet loss, 90 seconds at a time, gets a $7.5M annual bill and no attention at all. 

    Try it yourself 

    Walk one of your lines for 30 minutes during normal running. Tally three things: 

    • Every time the line stops or hesitates. 
    • Whether each stop was over or under 10 minutes. 
    • Whether anyone wrote it down. 

    Then ask how much of what you just watched is actually making it into your reported OEE. The gap between what you saw and what got recorded is your minor-stops opportunity, and it’s usually a lot bigger than anyone expects. 

    Key takeaways 

    • Equipment losses split into 4 scheduled and 7 unplanned. The 7 unplanned are the ones that move OEE. 
    • Speed losses and minor stops are the most under-counted, and often the largest. 
    • Most plants over-focus on breakdowns because they’re visible. The bigger money usually hides in minor stops, speed, and quality losses. 
    • If you can’t tell a Process Failure from a Breakdown, you can’t match the right strategy to the loss. 


    Coming next, Part 2, Post 3: The 9 Human Efficiency Losses. 

  • Business Acumen: Where the Money Hides

    Business Acumen: Where the Money Hides

    Where the Money Hides 

    Profit is not won by big swings. It’s won by spotting the leaks that drain it every day. 

    The 30 Losses Framework 

    Walk into your plant tomorrow and ask one question: “Where are we losing money?” You’ll get a different answer from every department. Operations will say breakdowns. Maintenance will say bad operating practices. Engineering will say poor design. Finance will say overspending. 

    Here’s the thing. They’re all right. They’re each describing one part of the same elephant. What they’re missing is a single map that names every part at once, so the plant can stop arguing about whose answer is correct and start working the whole animal. 

    That map is the 30 Losses framework. 

    The idea, in plain English 

    The 30 Major Losses are the 30 buckets where time, effort, and material slip away in a manufacturing facility. If you know which bucket your loss is in, you know where to go to get it back. 

    That’s the whole value of naming things. A vague sense that “we’re leaving money on the table” funds nothing. “We have a speed loss bucket worth $40,000 a month on Line 3” funds a project. The framework turns a feeling into a target. 

    Three families of loss 

    The 30 losses sort into three families: 

    • 11 Equipment Losses. Time and capacity lost on the machines themselves. 
    • 9 Human Efficiency Losses. Time and effort lost in how people work. 
    • 10 Resource Losses. Money lost in materials, energy, and inventory. 

    This split does real work for you. Together these categories tell you whether your problem is a machine problem, a people problem, or a resource problem; and that distinction decides where you should spend your improvement dollars. Pouring maintenance budget at what is actually a materials problem is how plants stay busy and broke at the same time. 

    How the losses stack up 

    Picture a waterfall. You start at the top with all the hours theoretically available to a machine, 168 hours in a week, and you chip away. 

    • First you subtract scheduled downtime, the time you planned not to run. 
    • Then you subtract the unplanned losses, the breakdowns and stops. 
    • Then you subtract speed losses, the gap between design pace and actual pace. 
    • Then you subtract quality losses, the output you made but couldn’t sell. 

    Whatever survives at the bottom is your real productive output. The same waterfall logic applies to people and to resources. Every loss bucket is just a place where water leaks out on the way down. 

    The three roll-ups that score it 

    Three terms summarize how badly the 30 losses are bleeding you. We’ll calculate each one in Part 3; for now, just learn what they mean. 

    Metric  What it measures  Goal 
    Loading  How much of available time you scheduled to run  High enough to meet demand without burning out the plant 
    OEE (Overall Equipment Effectiveness)  Of the time you scheduled, how productive the equipment actually was  World-class is about 85%. Most plants live around 40% to 60%. 
    TEEP (Total Effective Equipment Performance)  Of all available time, 24 hours a day, every day, what did you actually produce?  Reveals the true ceiling. Big TEEP gaps mean big hidden capacity. 

    Why “hidden factory” is the phrase that matters 

    Here’s the line that should change how you see your plant. If your TEEP is 30%, you have a second factory hidden inside your factory. 

    You’re already paying for the building. You’re paying the depreciation on the equipment. You’re paying most of the labor. That capacity exists; it’s just buried under the 30 losses. And recovering it is almost always far cheaper than building a new line. The 30 losses are the map to that hidden factory, and a typical plant is sitting on a hidden factory worth 30% to 50% of its current capacity. 

    That’s not a rounding error. That’s a second plant you already own. 

    Try it yourself 

    Before the next post, do a back-of-the-envelope estimate for one critical line: 

    • Roughly what percentage of scheduled time does it actually run well? That’s a rough feel for OEE. 
    • Now factor in all the hours it isn’t even scheduled. That gets you toward TEEP. 

    You don’t need precision yet. You’re just trying to feel the size of the gap between what you produce and what you could. That gap is the rest of Part 2. 

    Key takeaways 

    • 30 losses, three families: Equipment (11), Human Efficiency (9), Resources (10). 
    • Loading shows how much you tried; OEE shows how well the equipment ran; TEEP shows the full opportunity. 
    • A typical plant has a hidden factory worth 30% to 50% of its capacity sitting inside its current walls. 
    • You can’t fix what you can’t name. Naming the loss is the first job, and it’s what this part of the series is for. 


    Coming next, Part 2, Post 2: The 11 Equipment Losses. 

  • Business Acumen: Profit vs. Cash, Why They Are Not the Same

    Business Acumen: Profit vs. Cash, Why They Are Not the Same

     Profit vs. Cash, Why They Are Not the Same 

    This is the post most operators and maintainers would skip. Don’t. The day you understand the difference between profit and cash is the day your business cases start getting approved faster. 

    We’ve covered how the business makes money and how to read its three statements. Now comes the idea that quietly decides whether your projects live or die, and almost nobody on the floor is taught it. 

    Profit and cash are not the same thing. They feel like they should be. They are not. Understanding why is one of the most valuable things you can carry into a budget meeting. 

    The simple distinction 

    In plain English. Profit is an accounting concept. It’s what the books say after revenue and expenses are matched up, even if the cash hasn’t actually moved. 

    Cash is the green stuff in the bank. You either have it or you don’t. 

    Here’s the uncomfortable part: a company can post a profit on paper while running out of cash, and a company can be sitting on plenty of cash while losing money. The two numbers tell different stories, and you need to be fluent in both. 

    How they drift apart 

    There are a handful of everyday situations that pull profit and cash in different directions. You’ll recognize all of them. 

    • Inventory builds up. You spent cash buying raw material and converting it, but it’s sitting as work in process or finished goods. That cost parks on the balance sheet as inventory, not in COGS; so profit looks fine, but the cash is gone. 
    • Customers pay slowly. You shipped the product and recorded the revenue and profit, but the cash won’t land for 60 days. Meanwhile, payroll is due Friday. 
    • Big capital projects. You wrote a $2M check for a new line, but only a slice of it gets depreciated this year. Cash is way down; profit barely moved. 
    • Spare parts hoarding. You bought $300K of insurance spares because everyone insisted “we have to have these.” Profit is unchanged. The cash is gone. 

    Why plant leaders should care 

    This isn’t trivia for the finance team. It’s directly about whether your work gets funded. Three reasons: 

    • Capital approvals depend on cash. If the company is cash-tight, your $500K reliability project can get deferred even when the ROI is excellent. The “no” you heard wasn’t about value. It was about cash. 
    • Inventory decisions are cash decisions. Every reduction in excess work in process or dead MRO is cash handed back to the company. That’s a win you can deliver without selling a single extra unit. 
    • “Save money” sometimes means “free up cash,” not “cut expense.” Knowing which one you’re offering changes how you frame the pitch, and changes who says yes. 

    A story your CFO will love 

    Real-world example: the MRO stockroom cleanup. A plant audits its spare-parts stockroom and finds: 

    • $1.2M of MRO inventory on the books. 
    • $340K of it hasn’t moved in five or more years; obsolete or duplicates. 
    • $180K is for equipment no longer even in service. 

    They sell or write off the obsolete parts and tighten the min and max levels on the rest. The result is about $400K of cash returned to the company. The income statement barely flinches, because write-offs actually sting profit in the short term, but the balance sheet and cash position improve in a big way. 

    That is a story the CFO loves, and notice why: it hurt profit slightly while freeing real cash. If you only spoke the language of profit, you’d never pitch it. Because you understand cash, you can. 

    Try it yourself 

    Walk your stockroom, or pull the MRO inventory report. Then: 

    • Find three line items that look like they haven’t moved in years. 
    • Estimate the dollar value sitting on the shelf. 
    • Ask two questions: do we still own the equipment those parts support, and are they still needed? 

    This is a five-minute exercise that routinely surfaces five- and six-figure cash opportunities hiding in plain sight. 

    Key takeaways 

    • Profit and cash are not the same, and a plant leader needs to be fluent in both. 
    • Inventory ties up cash without touching profit until it moves. 
    • Spare parts strategy is a cash strategy. 
    • When a project gets deferred, it’s often a cash issue, not a value issue. Frame it accordingly. 

    Wrapping up Part 1 

    You now have the foundation: how the business makes money, how to read its statements, and why cash and profit tell different stories. That’s “thinking like the business.” From here on, you can look at anything on your floor and ask the only questions that get things funded. What is this doing to cost, to cash, and to risk? 

    Next, we put that lens to work and go hunting. There’s far more money leaking out of your plant than anyone is tracking, and most of it is hiding in places nobody thinks to look. 


    Coming next, Part 2: Where the Money Hides.

  • Business Acumen: Financial Statements for Operators

    Business Acumen: Financial Statements for Operators

    Financial Statements for Operators 

    You don’t need to read them like an accountant. You need to read them like the person who moves the numbers on them. 

    Say the words “financial statements” in a plant and watch people’s eyes glaze over. Don’t let yours. Here’s the good news: there are only three, and you only need a working understanding of each. Together they answer three plain questions. Is the company healthy? Is it growing? Can it pay its bills? 

    Once you can read these three the way you read a downtime report, the budget conversation stops being intimidating and starts being a place where you have the upper hand. 

    The three statements at a glance 

    Statement  What it tells you  Plant floor translation 
    Income Statement  Did we make a profit over a period of time?  Did we ship more value than we burned in costs? 
    Balance Sheet  What do we own and what do we owe right now?  How much inventory and equipment is sitting around? 
    Cash Flow Statement  Did cash actually come in or go out?  Can we pay vendors, payroll, and capital projects this month? 

    The income statement (the P&L) 

    Read it top to bottom and it tells a story: 

    • Revenue. What we sold. 
    • Minus Cost of Goods Sold (COGS). What it cost to make what we sold: materials, direct labor, manufacturing overhead. 
    • Equals Gross Profit. 
    • Minus Operating Expenses. Sales, general and administrative, R&D, other overhead. 
    • Equals Operating Income (EBITDA). 
    • Minus Interest, Taxes Depreciation and Amortization. 
    • Equals Net Income. 

    Here’s the part that should make you sit up. Almost everything that happens on your floor lands in one line: COGS. Scrap, rework, breakdown overtime, energy, raw material; all of it flows into Cost of Goods Sold. That is why plant performance is one of the most direct ways to move profit in the entire company. You are not a support function on this statement. You are sitting on the biggest lever it has. 

    Real-world example: how one bad week shows up. A bottling plant strings together breakdowns in week 3 of the month. Watch where it lands on the income statement: 

    • Volume drops, so revenue falls about $180,000. 
    • Overtime to catch up pushes COGS labor up $22,000. 
    • Expedited freight to hit customer dates adds $15,000 to COGS freight. 
    • Scrap from startup defects after each restart adds $9,000 in COGS materials. 

    Total profit hit: roughly $226,000 in one week, and most of it stayed invisible until the month closed. 

    That last line is the whole point. The damage was real on the floor in week 3, but nobody felt it on paper until the books closed weeks later. The person with business acumen connects those two moments before the month ends. 

    The balance sheet 

    If the income statement is a movie of a time period, the balance sheet is a photograph taken on a single day. It shows everything the company owns and everything it owes. 

    Assets = Liabilities + Equity 

    What we have = what we owe + what’s left for the owners. 

    Where does the plant show up here? 

    • Inventory. Raw materials, work in process, and finished goods. Every dollar tied up here is a dollar not earning anything else. 
    • Property, Plant and Equipment. Your machines, lines, and building. Their value is depreciated over time. 
    • Spare parts (MRO). Sometimes counted as inventory, sometimes capitalized. Either way, it’s cash sitting on a shelf. 
    • Accounts Payable. What you owe vendors for materials and services you haven’t paid for yet. 

    Notice the tension built into your stockroom. Carry too much “just in case” spare-parts inventory and you tie up cash that could be working elsewhere. Carry too little and you risk extended downtime when a critical part isn’t on hand. There’s no perfect number; there’s a strategy, and we’ll build it in Part 5. 

    The cash flow statement 

    This is the one that trips people up, so I’ll keep it short here and give it the full treatment in the next post. The headline is this: a company can be profitable and still go broke, because profit and cash are not the same thing. The cash flow statement tracks the actual money moving in and out of the bank account, in three buckets: 

    • Operating cash flow. Cash from running the business. 
    • Investing cash flow. Cash spent on, or received from, buying and selling assets like equipment. 
    • Financing cash flow. Cash from loans, investors, dividends, and debt repayment. 

    Hold that thought. The gap between profit and cash is where a lot of good plant decisions live or die, and it’s exactly where we’re headed next. 

    Try it yourself 

    Pull your plant’s last income statement or ask Finance for one. Find: 

    • Total revenue for the period. 
    • COGS. 
    • Gross profit (revenue minus COGS). 
    • Gross margin percentage (gross profit divided by revenue). 

    Then estimate one thing: what happens to gross margin if your plant cuts unplanned downtime by 5%? Even a rough number is fine. The point isn’t precision yet; it’s building the muscle of connecting a floor action to a financial line. 

    Key takeaways 

    • There are only three statements, and you only need a working grasp of each. 
    • Income Statement is the profit story, and COGS is where your floor lands. 
    • Balance Sheet is what you own and owe; inventory, equipment, and spare parts are your footprint on it. 
    • Cash Flow is actual money movement, and profit and cash are not the same thing. 
    • Plant performance moves COGS directly, and COGS moves net income directly. You hold a real lever. 


    Coming next, Part 1, Post 3: Profit vs. Cash, Why They Are Not the Same.