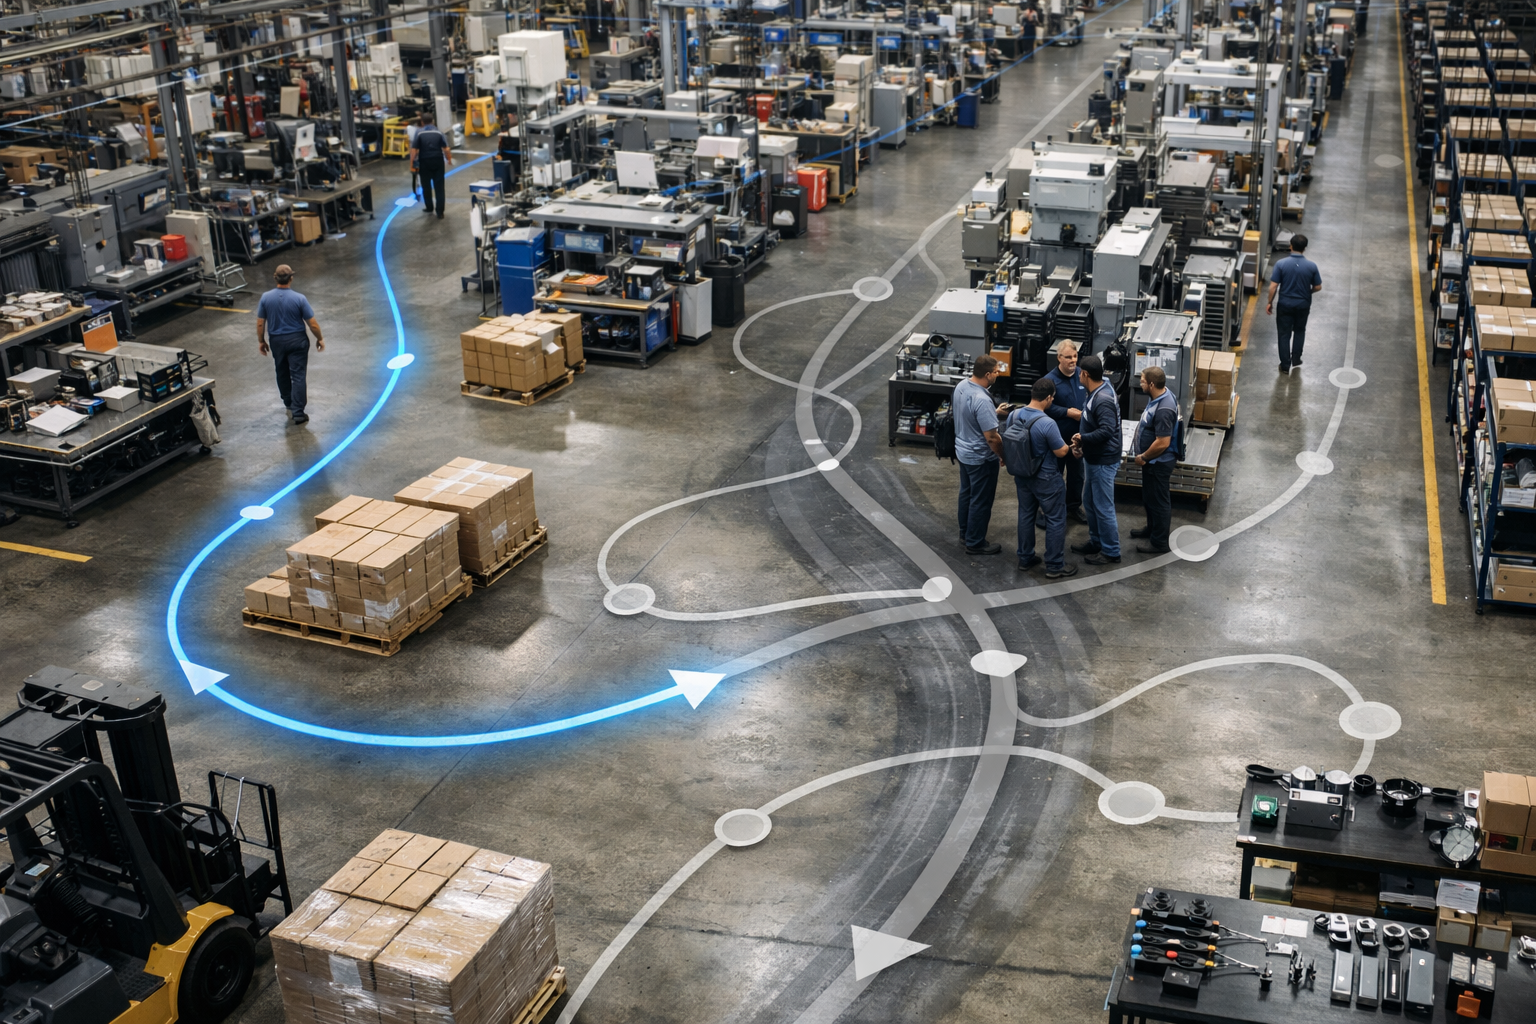
The equipment losses are about how the machines run. These are about how the people work. Same waterfall, completely different fix.
If the 11 equipment losses are where reliability work pays off, the 9 human efficiency losses are where it doesn’t. That’s the single most important thing to understand about this category: these losses mirror the equipment ones, but you don’t solve them with maintenance. You solve them with planning, organization, training, and better physical layout. Throw a reliability program at a planning problem and you’ll spend money fixing machines that were never the issue.
These nine split into three scheduled labor losses and six others.
The three scheduled labor losses
These are the labor side of your planned downtime. The equipment was supposed to be down; the question is whether the people were used well while it was.
- Scheduled Maintenance Labor Losses. Maintenance labor sitting idle during planned windows. If your wrench-time during scheduled work is 35%, then two-thirds of your maintenance labor is non-productive even on a good, planned day.
- Scheduled Engineering Labor Losses. Engineering labor wasted during planned project windows, usually from scope creep, unclear handoffs, or late parts and drawings. Engineering hours are among the most expensive in the plant, so wasting them hits your project capital costs directly.
- Scheduled Operations Labor Losses. Operations labor lost during planned operations windows. Ten people standing around for a 15-minute handoff briefing is a real, recurring loss, every shift, forever.
The six other human efficiency losses
- Management and Planning Losses. Wait time caused by poor planning of the work itself: waiting for materials, tools, instructions, permits, or for equipment to be released. This is the single biggest source of lost wrench-time in maintenance, and it’s almost always a symptom of a reactive culture rather than lazy people.
- Operating Motion Losses. Inefficiency in how operators have to move: bending, stretching, walking to fetch parts, hunting for tools. The hidden cost here isn’t just slower work; it’s injury risk. Every workers-comp incident is six figures of direct cost plus the productivity and morale damage around it.
- Line Organization Losses. Inefficiency from how the line is laid out and how the workload is balanced across stations. It shows up as the same operators always being overloaded while others sit idle, or as bottlenecks nobody can quite explain.
- Logistics Losses. Time lost moving material around the plant: operators walking for parts, dollies waiting on forklifts, work backing up because the next station can’t accept it. A finished pallet that sits 20 minutes waiting for a forklift is 20 minutes of unnecessary tied-up product, plus a safety hazard.
- Waiting Losses. Operators waiting on equipment, materials, instructions, or each other. Easy to spot, hard to act on. This is one of the most demoralizing losses there is, because idle time tells your people that nobody values their time.
- Setup and Adjustment Labor Losses. The labor side of equipment setup and adjustment, where skilled people are tied up redoing work that should have been right the first time. It’s a doubled cost: the equipment is down, and high-skill labor is being burned on something that was preventable.
Real-world example: wrench-time on a reactive shift. A maintenance supervisor films a typical shift. Out of eight paid hours per technician:
- Actual wrench time on equipment: 2.1 hours.
- Walking to and from the parts crib: 1.4 hours.
- Looking for tools: 0.9 hours.
- Waiting for permits or for production to release equipment: 1.1 hours.
- Waiting for instructions or supervisor decisions: 0.6 hours.
- Breaks, meetings, and paperwork: 1.9 hours.
Wrench-time comes out to 26%. With proper planning and kitting, world-class crews hit 55% to 60%. Closing that gap means doing roughly twice the work with the same headcount. That, in one shift, is a Management and Planning Loss you can see and size.
Wrench-time is the canary
If you want one number that tells you whether your plant has a human efficiency problem, it’s wrench-time: the share of paid maintenance hours actually spent turning wrenches on equipment. A reactive plant runs around 25% to 35%. A well-planned plant runs 55% to 65%. That gap isn’t about working harder. It’s about whether the work was set up so people could do it.
Try it yourself
Pick one of these to put a rough dollar value on this week:
- Time spent waiting for parts across your last five work orders.
- Distance an operator walks on your busiest line in a single shift, roughly estimated.
- The number of times someone had to stop and ask a supervisor for a decision before they could keep working.
Each of these is a number, and each number has a cost. Try to attach one.
Key takeaways
- Human efficiency losses mirror the equipment losses, but the fix is planning, organization, and training, not maintenance.
- Wrench-time is the canary: a reactive plant runs 25% to 35%, a planned plant 55% to 65%.
- Operating motion and line organization losses are large but invisible. They surface as fatigue, injuries, and bottlenecks.
- Waiting losses crush morale. Fix them and engagement rises right alongside productivity.
Coming next, Part 2, Post 4: The 10 Resource Losses.
If you want to understand where your labor hours are slipping away, start with one number this week. Measure it. Put a dollar value on it. When you can see the loss, you can recover it. If you want help quantifying these losses inside your plant, reach out and we will walk you through the first assessment.