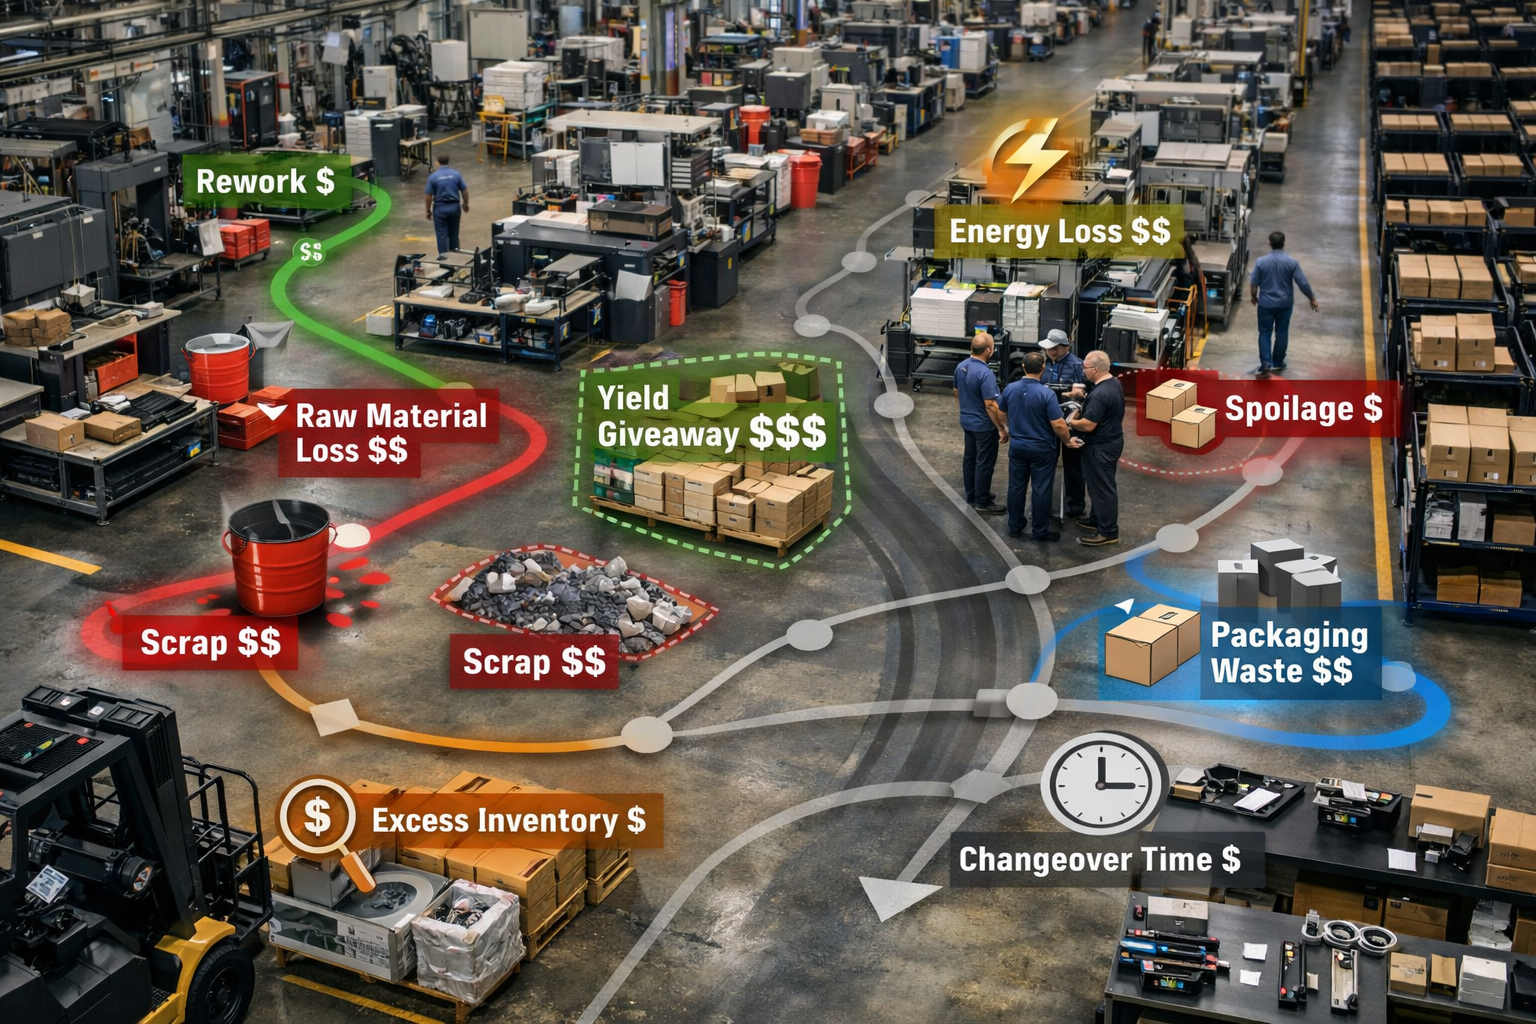
Equipment and labor losses cost you time. Resource losses cost you the stuff itself. And these are the ones Finance can already see.
Here’s why this last category is special. The equipment and human losses show up as time, and time has to be translated before Finance feels it. Resource losses skip the translation. They land straight in cost-per-unit and gross margin, which means they’re the losses your CFO is most likely to already believe. That makes them the easiest place to build a business case, and the rest of this series leans heavily on what you find here.
There are ten of them.
- Rework. Producing a unit that isn’t acceptable as-is but can be repaired and sold. It’s a triple cost: the original materials, the labor to redo it, and the line time you spent reworking instead of making something new.
- Raw Material Losses. Material lost to leaks, loose specs, contamination, damage, and poor storage. This is the one most often shrugged off as “the cost of doing business,” yet it commonly runs 1% to 3% of total raw material spend, which is real money on any plant of size.
- Scrap. Material consumed in conversion that can’t be sold as the primary product: trim, edges, mixing residue. Sometimes you recover it as regrind, sometimes you don’t, but either way it dilutes your yield.
- Spoilage. Product so off-spec or damaged it can’t even be reworked. This is the most expensive loss of all, because both the material and every hour of labor invested in it drop to zero value.
- Packaging Materials Losses. Film, boxes, labels, and cases lost to defects, poor storage, and equipment misalignment. Often 2% to 5% of packaging spend, and almost entirely invisible until someone audits it.
- Excess Inventory Losses. Cash tied up in inventory you don’t actually need, usually from forecasting errors and “just in case” thinking. Every dollar parked there is a dollar not paying down debt or funding improvements, and the carrying cost alone typically runs 15% to 25% a year.
- Energy Losses. Energy wasted to compressed-air and steam leaks, idle-running equipment, oversized motors, and missing shutdown protocols. Studies consistently find 20% to 30% of plant energy is recoverable. On a plant spending $5M a year on energy, that’s $1M to $1.5M walking out the door.
- Yield Losses. Giving away product because nobody trusts the process to hold a tighter spec. The classic case: a two-pound spec consistently filled at 2.05 to 2.10 pounds because the line can’t be trusted to stay above 2.0. That extra fraction of a pound on every unit is pure giveaway.
- Changeover Time Losses. Production lost during product changeovers, driven by untrained operators, missing parts, and steps run one after another that could run in parallel. A line running six changeovers a week at 90 minutes each loses nine hours a week. Cutting changeover time in half is often worth $1M to $2M a year on a single line.
- Overspending. Paying more than necessary on maintenance, MRO, contractors, supplies, and energy. The big driver is reactive work: every $1 of reactive maintenance costs roughly three to five times what the same job costs when planned. A plant running 40% reactive is overspending dramatically against one running 10% reactive.
Real-world example: the yield giveaway nobody noticed. A bagged-snack plant fills a 6 oz bag at an average of 6.18 oz, just to be sure they never go under spec. Annual volume is 50 million bags. That 0.18 oz per bag, across 50 million bags, is 9 million ounces, or 562,500 pounds of product given away every year. At a finished cost of $1.40 a pound, that’s $787,500 of pure giveaway annually, money walking straight out the door. The fix, tighter process control with predictive checkweigher feedback, cost $120,000. Payback: under two months.
That example is the whole category in miniature. Nothing broke. Nobody got hurt. No alarm went off. The plant simply gave away three-quarters of a million dollars a year, politely, one bag at a time, until somebody finally measured it.
Try it yourself
Identify your top three resource losses by dollar value:
- Pull or estimate the annual spend for each candidate: rework, scrap, packaging waste, energy, MRO, and so on.
- For each, estimate what a 10% reduction would save.
- Rank them by dollar opportunity, not by which one is easiest to fix.
Keep that ranked list. It becomes the raw material for the first business case we build in Part 4.
Key takeaways
- Resource losses are usually invisible until audited, and once measured they’re almost always bigger than expected.
- Energy waste, MRO obsolescence, and yield giveaway are the three most under-investigated buckets in most plants.
- Rework, scrap, and spoilage tend to get reported. The other seven buckets often don’t.
- Resource losses connect directly to gross margin, so reducing them moves the financial statements faster than anything else on the floor.
Wrapping up Part 2
You now have the full map. Thirty places money leaks out of a plant, sorted into machines, people, and resources, and you can tell which family any given loss belongs to. That alone puts you ahead of most rooms, because you can stop arguing about whose department is to blame and start pointing at named, sizeable targets.
But naming a loss isn’t the same as sizing it. A target you can’t measure still won’t get funded. So next we turn the 30 losses into numbers a CFO can act on, starting with the two that summarize everything: OEE and TEEP.
Coming next, Part 3: Measuring What Matters.
If you want to see where your plant’s money is quietly leaking, start with the resource losses. They’re already visible in your financials. You just have to measure them. If you want help identifying and quantifying these losses inside your operation, reach out.