Category: ReliabilityX Blog

  • Your P&L Cannot See a Lost Hour 

    Your P&L Cannot See a Lost Hour 

    There is a reason smart executives look at complete, accurate financial statements every month and still cannot find the largest margin opportunity in the building. The statements are not wrong. They are answering a different question. 

    What happens to an hour that never ran 

    By the time production reaches the P&L, output has been converted into cost of goods sold, absorbed overhead, and variance. Every one of those figures describes what was produced. 

    The hours that were not produced have no representation. There is no line called capacity not collected. There is no variance account for the four hundred bags the case packer could have run during the shift it spent waiting on a changeover that took longer than it should have. 

    The only trace those hours leave is indirect. Fixed cost spread across fewer units raises absorbed cost per unit, which shows up next quarter as unit cost creep. In the review meeting, that gets discussed as inflation, supplier pricing, or product mix. It is occasionally all three. It is also, quite often, hours. 

    Why the plan makes it worse 

    The plan is the second layer of concealment, and it is well intentioned. 

    Plans are built from history, because history is the most defensible input available. Last year’s actuals become this year’s baseline, adjusted for demand and known changes. That is a reasonable way to run a scheduling function. 

    It is a terrible way to measure capacity. Every loss embedded in last year’s performance gets inherited into this year’s plan and then hidden by it. Beat the plan and the plant is congratulated. Nobody asks what the asset was capable of, because the plan has quietly become the answer to that question. 

    So you end up with a plant that looks efficient against a target that was set by its own historical losses. 

    The question that finds the money 

    Stop asking whether the plant hit plan. Ask this instead: 

    How many units did this asset have every resource to produce, and how many did it produce? 

    Every word in that sentence is doing work. Every resource means staffed, powered, supplied, and scheduled. It excludes the shifts you did not staff. It is a fair question, answerable from data you already own, and it produces a number the P&L will never give you. 

    On the packaging line we have been using, the answer is uncomfortable. At 600 bags per hour design rate across 417 scheduled hours in the month, the asset had every resource to produce 250,000 bags. It produced 162,500. 

    The gap to plan was 12,500 bags and $125,000. The gap to what the asset could actually do is 87,500 bags and $875,000 for the month. Same asset, same month, same data, and a number roughly seven times larger. 

    Two ledgers, one plant 

    It helps to think of it as two sets of books that never reconcile. 

    The financial ledger records what you shipped and what it cost. It is audited, governed, and correct. It is also complete only with respect to transactions that occurred. 

    The capacity ledger records what the assets could have delivered and did not. Nobody keeps it. It is not audited because it is not written down. And it holds the larger of the two numbers in most manufacturing plants. 

    You do not need to replace the first ledger. You need to start keeping the second one, on one asset, for one month. 

    What to do this week 

    Take the asset you picked on Monday. Find its design rate from the nameplate or the original equipment documentation, then confirm it against the best sustained rate anyone remembers running. Use the lower of the two, because a conservative number you can defend beats an ambitious one you cannot. 

    Multiply design rate by scheduled hours. Subtract actual good output. Multiply by contribution margin. 

    Expect the result to feel too large. Do not shrink it to feel comfortable. Test it instead. 

  • The Number Your Plant Missed Last Month, and Nobody Could Price It 

    The Number Your Plant Missed Last Month, and Nobody Could Price It 

    Last month your plant made money. It also missed the plan. Both of those things are on the same report, and if you walked into the morning meeting and asked what the miss was worth in contribution margin, you would most likely get silence, followed by three explanations, none of which carries a dollar sign. 

    That silence is worth about $1.5mm a year on a single asset. Here is how that number gets built. 

    The three explanations that never survive a follow up question 

    “We had a rough month.” This describes the result, not the cause. It cannot be sized, compared against last quarter, or attached to an action. It is a summary of the thing you were trying to explain. 

    “The equipment is old.” Age is not a loss category. Two identical assets, purchased the same year, installed on the same site, routinely run twenty points apart. If age were the cause, that would not happen. 

    “We are short people.” Sometimes true and usually incomplete. It rarely explains why the same crew delivered plan the month before with the same headcount. 

    None of these are dishonest. They are what capable people say when nobody has given them a counting system. The failure here is structural, not personal. 

    Why the number matters more than the excuse 

    Consider a packaging line with a case packer as the constraint. The plan for the month was 175,000 bags. Actual good output was 162,500. The gap is 12,500 bags. 

    Contribution margin on that product is $10 per bag, which is price less variable cost. Not gross margin, not revenue. Contribution margin, because the fixed cost base gets paid whether the line runs or not, so the full margin on recovered volume drops to the bottom line. 

    12,500 bags at $10 is $125,000 for the month. Annualized, that is $1.5mm on one asset. 

    That figure did not require new instrumentation, a software purchase, or a consultant. It required plan, actual, and one number from finance. 

    And here is the part worth sitting with: $1.5mm is the small number. It is the gap to a plan that was already discounted to what the line has been doing. The gap to what the asset can actually produce is considerably larger, and we will get to that. 

    Unmeasured margin never gets funded 

    This is the mechanism that keeps the money on the floor. 

    Finance cannot approve a number that does not exist. A capital committee is not hostile to reliability work, it is simply comparing proposals, and the proposal that arrives with a documented figure beats the one that arrives with a conviction. Capital flows toward the best documented problem, not the biggest one. 

    So the plant that describes its losses qualitatively competes for funding against a plant that describes them in dollars, and loses every time, regardless of which one actually has the larger opportunity. 

    Sizing the loss is not an accounting exercise you do after the improvement work. It is the first act of leadership on the problem, and it is what makes everything downstream possible. 

    What to do this week 

    Pick one asset. The one that sets the pace, where a stop stops the shipment. Pull plan against actual good output for the last eight weeks. Ask finance for contribution margin per unit, in writing, even if it is just an email. 

    Multiply the gap by the margin. Write the answer as one sentence with a dollar sign in it. 

    That sentence is a better management tool than any dashboard you will be sold this year, and it costs you fifteen minutes. 

  • Pick One Asset. Just One. 

    Pick One Asset. Just One. 

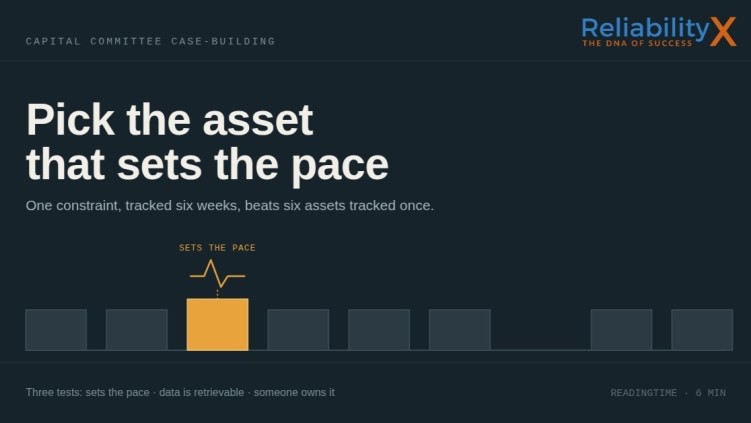
    Most efforts to quantify plant losses fail in week two, and the cause is almost always the same. Somebody decides that if one asset is worth measuring, the whole line is worth measuring, and by the end of the month there are eleven partial data sets and no defensible number. 

    One asset, followed for six weeks, produces a case you can take to a capital committee. Six assets, followed for six weeks, produce a spreadsheet nobody trusts. 

    Here is how to choose the one. 

    Test 1: It sets the pace 

    When this asset stops, does the line stop and does the shipment move? 

    That is the whole test. If output upstream of the asset simply accumulates and gets processed later, you have found a busy asset, not a constraint. Recovering an hour there costs you the same effort and returns nothing to the plant, because the hour was never the limiting factor. 

    The constraint is usually obvious to the people who run the line and frequently invisible in reporting. Ask two operators and a supervisor where the line backs up. They will agree, and they will be right. 

    A caution: the constraint moves. Product mix, seasonal demand, and a maintenance backlog can all shift it. For a six week exercise, pick the asset that is the constraint most of the time and stay with it. Chasing a moving constraint week to week is how the effort dies. 

    Test 2: You can get the data 

    You need run time and output for at least eight weeks of history, plus the ability to observe the asset for two weeks going forward. 

    Perfect data is not the standard. Retrievable data is. A production log in a binder is enough. A shift handover sheet is enough. If the asset is instrumented and you can export it, that is faster, but nothing here requires it. 

    If the data does not exist in any form, that is itself a finding worth reporting, and it usually means picking a different asset for this first pass rather than starting a data collection project you will not finish. 

    Test 3: Somebody owns it 

    There has to be a named person, an operator, a planner, or a supervisor, who can actually change something about how the asset runs. 

    This is the test people skip, and it is the one that determines whether your number turns into money. An asset nobody owns produces an interesting figure, a good slide, and no change at all. When the analysis is done, someone has to be able to act on it without waiting for a reorganization. 

    Write it down and say it out loud 

    Once you have chosen, commit publicly. Tell your plant manager which asset you are following and why. Put the name in an email. 

    This sounds like a small thing. It is the difference between an exercise that survives the first busy week and one that quietly stops. Named commitments get kept. 

    Your fifteen minutes this weekend 

    1. Name the asset. 
    1. Pull plan against actual good output for the last eight weeks. 
    1. Email finance and ask for contribution margin per unit, which is price less variable cost. If they push back, that conversation is itself worth having, because a finance blessed margin figure is nearly impossible to attack later. 
    1. Multiply the eight week gap by the margin. 
    1. Write the result as one sentence. 

    You now have one asset and one dollar figure, which is more than most plants have, and it is the input for everything that follows.

  • Business Acumen: Cost-Benefit Analysis 

    Business Acumen: Cost-Benefit Analysis 

    If you can’t turn the loss into a number, the project won’t get funded. Here’s how you turn it. 

    Cost-Benefit Analysis 

    You’ve found the loss, sized it, and picked your target. Now you have to ask for money, and that means building a case. The most common tool for deciding whether a project is worth doing is the Cost-Benefit Analysis, and the good news is the math is simple. The hard part isn’t arithmetic. It’s being honest about both sides of the ledger. 

    A Cost-Benefit Analysis weighs the benefits, the gains and savings, against the costs, the spend and investment, required to get them. The goal is to answer two questions: is this project worth doing, and how fast does it pay back? 

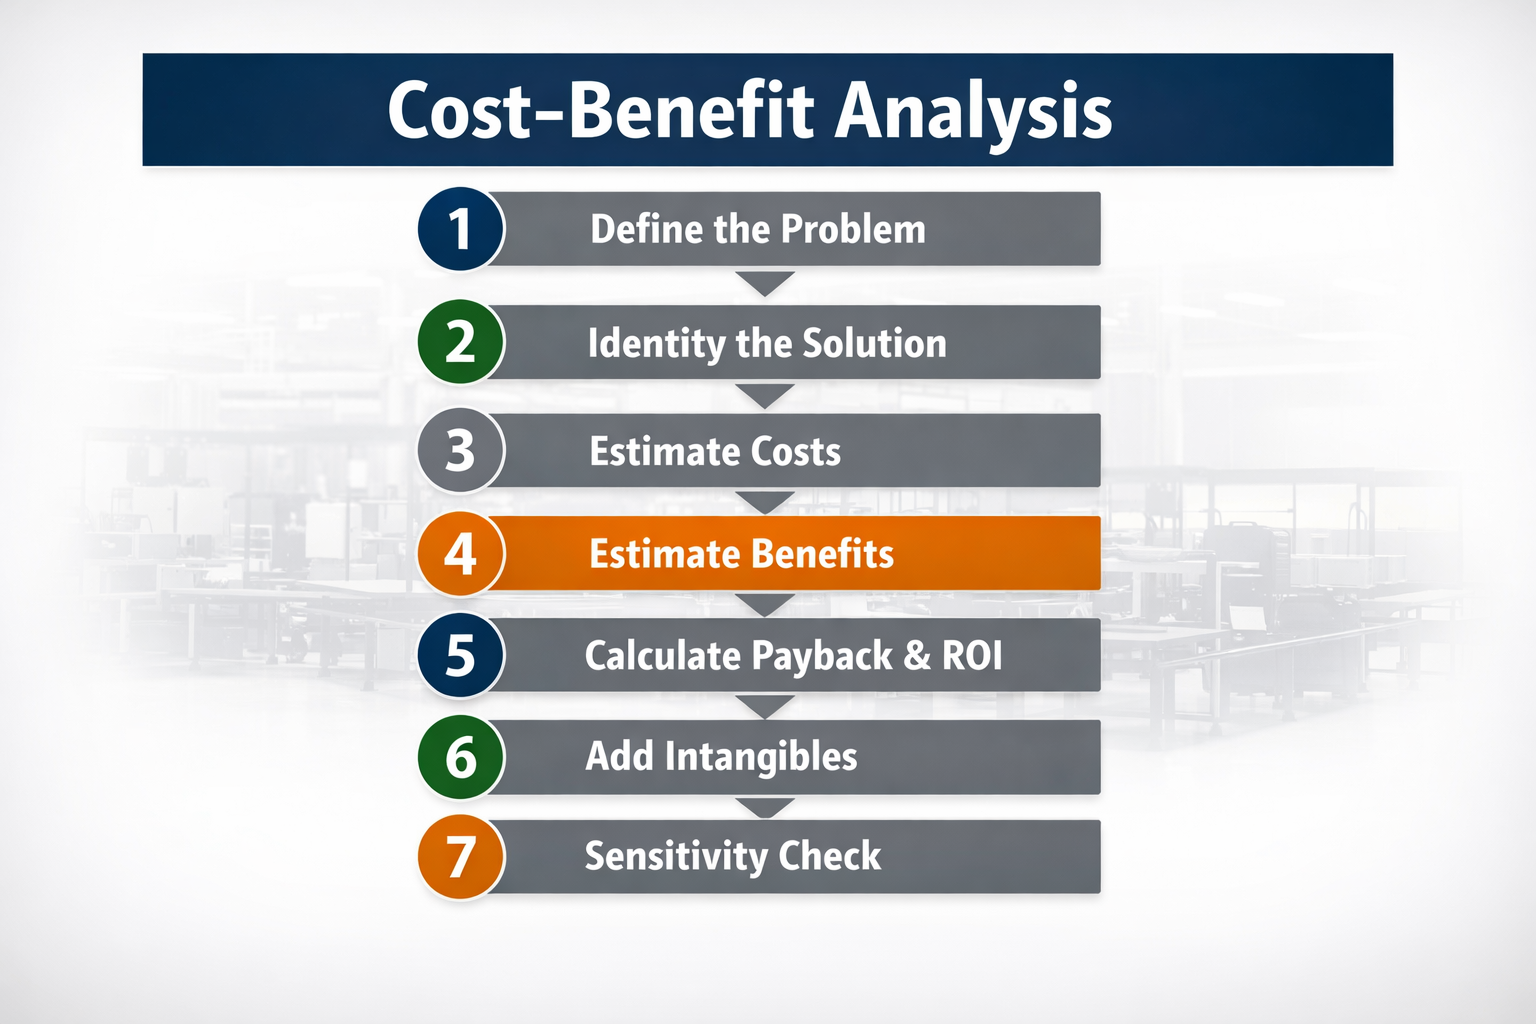
    Here’s the whole process in seven steps. Not seventy. Seven. 

    Step 1: Define the problem or opportunity 

    Be specific. Vague problems attract vague solutions and zero dollars. 

    • Weak: “The packaging line breaks down a lot.” 
    • Strong: “Unplanned downtime on the packaging line averages 8 hours a month, costing $24,000 a month in lost contribution.” 

    The difference between those two sentences is the difference between a complaint and a business case. 

    Step 2: Identify the solution 

    Propose a specific intervention with a scope, a timeline, and an owner. For example: precision alignment and balancing training for the six mechanics, plus a laser alignment tool kit. Concrete enough that someone could actually approve and schedule it. 

    Step 3: Estimate all the costs 

    All of them, not just the obvious capital number. The hidden ones are what sink projects after approval, when the real bill comes in higher than the pitch. 

    • Capital cost, such as equipment and tools. 
    • Labor, including training time, install labor, and project management. 
    • Materials and consumables. 
    • Lost production during install or startup. 
    • Ongoing costs, such as software licenses, maintenance, and recalibration. 

    Step 4: Estimate all the benefits 

    List both kinds, but only put the hard ones in the math. 

    Benefit type  Examples 
    Hard (use in the math)  Reduced downtime hours, less scrap and rework, less overtime, energy savings, longer asset life 
    Soft (mention, don’t count)  Improved morale, safer work, fewer customer complaints, less firefighting, easier hiring and retention 

    The discipline of using only hard dollars in the calculation is what makes your number credible upstairs. Soft benefits are real, but the moment you count them in the math, a skeptical CFO stops trusting the whole case. 

    Step 5: Calculate payback and ROI 

    Payback Period = Total Cost / Annual Benefit 

    ROI % = ((Annual Benefit – Annual Cost) / Total Cost) x 100 

    Step 6: Add the intangibles, separately 

    List the soft benefits on their own. They don’t change the math, but they tip close calls and they matter in the leadership conversation. Just keep them clearly out of the numbers. 

    Step 7: Run a sensitivity check 

    Ask the obvious “what if” questions before someone else does: 

    • What if the downtime savings come in at only half what we projected? 
    • What if costs run 20% over? 
    • What if it takes twice as long to implement? 

    If the project still wins under reasonable downside assumptions, you have a solid case. If it only works when everything goes perfectly, you don’t. 

    Real-world example: a precision alignment program. Problem: 8 hours a month of downtime tied to bearing failures, misalignment, and vibration. At $3,000 an hour in contribution, that’s $24,000 a month, or $288,000 a year. 

    Solution: laser alignment tools, training, and precision standards. 

    Costs: alignment tools $15,000, training for six mechanics $10,000, implementation labor $5,000. Total cost $30,000. 

    Benefits: six fewer downtime hours a month at $18,000 a month is $216,000 a year, plus $6,000 a year from extended bearing life and $4,000 a year from fewer rebuilds. Total benefit $226,000 a year. 

    The math: payback is $30,000 / $226,000, about six to seven weeks. ROI is (($226,000 – $30,000) / $30,000) x 100, which is 653%. 

    Verdict: invest immediately. 

    A case like that doesn’t get debated. It gets approved, because every number in it is hard, conservative, and traceable. 

    Try it yourself 

    Pick a project off your wish list and build the CBA in seven lines: 

    • Problem statement, with the dollar value of the current loss. 
    • Solution. 
    • Total cost, all in. 
    • Annual benefit, hard dollars only. 
    • Payback period. 
    • ROI percentage. 
    • Sensitivity: does it still win if the benefit is only half? 

    If you can’t fill in that first line with a real dollar number, that’s your homework before you go any further. 

    Key takeaways 

    • CBA is seven steps, not seventy. Keep it simple. 
    • Include all costs, not just the obvious capital. Hidden costs are what sink projects after approval. 
    • Use only hard benefits in the math. Mention the soft ones separately. 
    • Always sensitivity-check at half the projected benefit. If it still wins, your case is strong. 

    Coming next, Part 4, Post 2: ROI, Payback, NPV, and BCR Made Simple.

    If you are ready to turn your improvement ideas into funded projects, ReliabilityX can help. Our team works directly with your data to build clear, defensible business cases that leadership approves with confidence.

    Contact us to schedule a review of your plant and learn how to translate reliability improvements into measurable financial results.

  • Business Acumen: Where to Focus First

    Business Acumen: Where to Focus First

    You can’t fix all 30 losses at once. Even the best plants pick two or three a year. This is how you choose. 

    By now you can name the losses and size them in dollars. That creates a new and better problem: you can suddenly see more opportunity than you could possibly chase. So the skill that matters now isn’t finding losses. It’s choosing which ones to attack first. 

    The 80/20 pattern shows up here too 

    On any given line, about 80% of the loss is usually packed into just two or three of the 30 buckets. You don’t need a program that boils the ocean. You need to find those two or three in your specific plant, then match the right fix to each. Everything else can wait. 

    Three questions, in order 

    When you’re deciding where to point your effort, ask these in sequence: 

    • Which loss is biggest in dollars? Not hours. Dollars. And as you’ll see in a moment, an hour on the bottleneck is worth far more than an hour anywhere else. 
    • What will the fix cost? Capital, labor, and organizational change all count. 
    • How fast will it land? Quick wins matter more than they look, because they build the credibility that gets your slower, bigger projects approved. 

    Match the strategy to the loss 

    A breakdown is not fixed the same way as a speed loss. One of the most common mistakes is applying a single favorite tool to every problem. Here’s the rough mapping: 

    Loss type  Best strategy 
    Breakdowns  Asset strategy optimization, reliability engineering, root cause analysis, precision maintenance, lubrication management 
    Process Failures  Process engineering, design improvements, operator training 
    Setup and Adjustments  Standardized procedures, centerline management, training, discipline 
    Speed Losses  Defect elimination, line condition, materials handling improvements 
    Minor Stops  Operator care routines, incoming material specs, centerlining, workplace organization 
    Startup Defects  Structured changeover reduction, centerline standards, PM effectiveness 
    In-Process Defects  Process control monitoring, in-process checks, supplier quality, operator training 

    The bottleneck rule, and why it changes everything 

    This is the single most important idea in the post. 

    An hour saved on the bottleneck is an hour of brand-new throughput. An hour saved anywhere else is just less idle time on a machine that was never the constraint. 

    The bottleneck is the slowest step in the chain, the one that sets the pace for everything downstream of it. Always find it before you decide where to invest. The implications are blunt: 

    • Cut breakdowns on a non-bottleneck, and your total output may not move at all. 
    • Cut minor stops on the bottleneck, and every hour you save flows straight to shipments. 

    Real-world example: the same hour, two different outcomes. A snack-foods plant runs a slicer (1,200 lb/hr) feeding a fryer (1,000 lb/hr) feeding a packaging line (950 lb/hr). The bottleneck is the packaging line at 950 lb/hr, because it’s the slowest step. Now watch two equally hard engineering projects: reducing slicer breakdowns by 50% produces exactly $0 of new revenue, because the slicer was never the constraint. Reducing packaging-line minor stops by 30% directly increases shipments. Same effort, completely different financial result. Always start at the bottleneck. 

    Quick wins versus long plays 

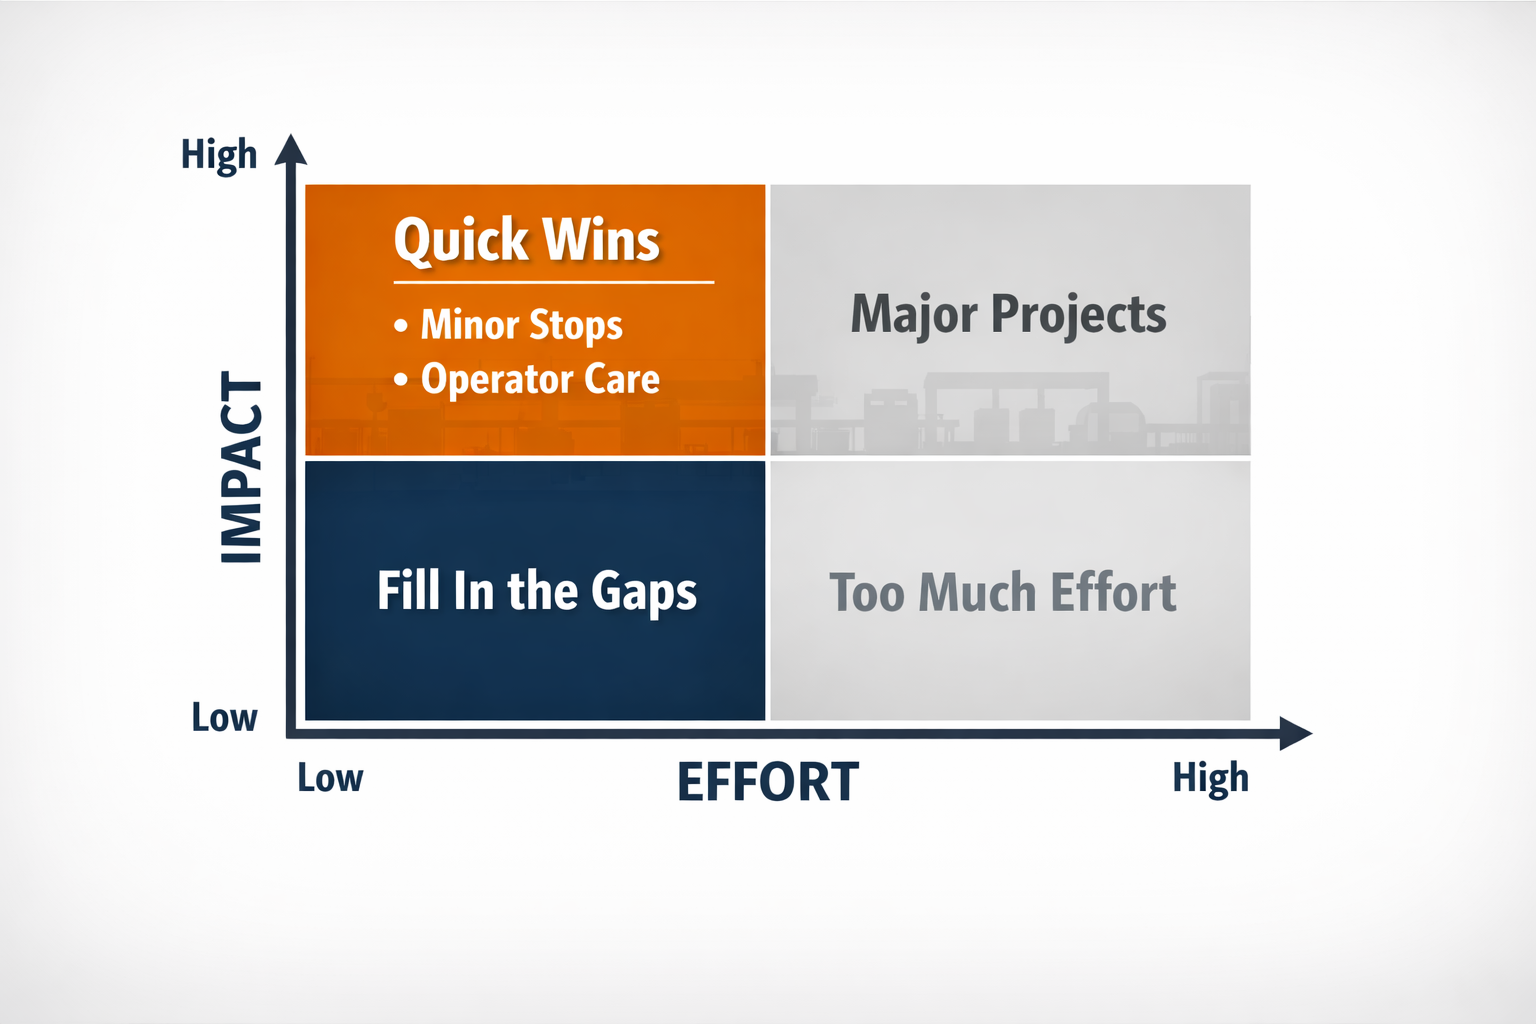
    Sort your candidate projects on a simple grid of impact against effort. 

      Low effort  High effort 
    High impact  Do first. These quick wins build credibility.  Plan. These are your major projects. 
    Low impact  Do if easy. Fill in the gaps.  Avoid. Not worth the cycles. 

    On a typical line, the two corners look like this: 

    • Quick wins: operator care routines, kitting parts before PMs, centerline standards, basic changeover improvements, and knocking out the top five minor-stop causes. 
    • Long plays: a predictive maintenance program, machine redesigns, capital projects, and control system upgrades. 

    Try it yourself 

    Go back to the OEE calculation you ran in the last post: 

    • Identify your top three losses by hours. 
    • For each, multiply hours per week by your contribution margin to get dollars per week. 
    • Plot each one on the grid above using your gut feel for effort and impact. 
    • Pick the upper-left item as your first project. Pick the upper-right item as your annual goal. 

    Key takeaways 

    • Pick the two or three losses that hold 80% of your dollar opportunity, and ignore the rest for now. 
    • Match the strategy to the loss type. Breakdowns and speed losses are not solved the same way. 
    • An hour saved on the bottleneck is worth more than an hour saved anywhere else. Always. 
    • Quick wins build the credibility that funds the long plays. 

    Wrapping up Part 3 

    You’ve now closed the gap between naming a loss and sizing it. You can calculate where a line really stands, translate any loss into annual dollars, and choose the two or three targets that matter most, with the bottleneck rule keeping you honest about which hours actually count. 

    That’s everything you need to walk into a room with a number. What you need next is the language that turns a number into an approved project: payback, ROI, and the cost of doing nothing. That’s Part 4. 


    Coming next, Part 4: Building the Business Case. 

    If you are ready to identify the two or three losses that hold most of your opportunity, ReliabilityX can help. Our team works directly with your data to pinpoint the bottleneck, quantify the dollar impact, and design the strategy that delivers measurable results.

    Contact us to schedule a focused review of your plant and start turning hidden losses into recovered margin.

  • Business Acumen: Profit vs. Cash, Why They Are Not the Same

    Business Acumen: Profit vs. Cash, Why They Are Not the Same

     Profit vs. Cash, Why They Are Not the Same 

    This is the post most operators and maintainers would skip. Don’t. The day you understand the difference between profit and cash is the day your business cases start getting approved faster. 

    We’ve covered how the business makes money and how to read its three statements. Now comes the idea that quietly decides whether your projects live or die, and almost nobody on the floor is taught it. 

    Profit and cash are not the same thing. They feel like they should be. They are not. Understanding why is one of the most valuable things you can carry into a budget meeting. 

    The simple distinction 

    In plain English. Profit is an accounting concept. It’s what the books say after revenue and expenses are matched up, even if the cash hasn’t actually moved. 

    Cash is the green stuff in the bank. You either have it or you don’t. 

    Here’s the uncomfortable part: a company can post a profit on paper while running out of cash, and a company can be sitting on plenty of cash while losing money. The two numbers tell different stories, and you need to be fluent in both. 

    How they drift apart 

    There are a handful of everyday situations that pull profit and cash in different directions. You’ll recognize all of them. 

    • Inventory builds up. You spent cash buying raw material and converting it, but it’s sitting as work in process or finished goods. That cost parks on the balance sheet as inventory, not in COGS; so profit looks fine, but the cash is gone. 
    • Customers pay slowly. You shipped the product and recorded the revenue and profit, but the cash won’t land for 60 days. Meanwhile, payroll is due Friday. 
    • Big capital projects. You wrote a $2M check for a new line, but only a slice of it gets depreciated this year. Cash is way down; profit barely moved. 
    • Spare parts hoarding. You bought $300K of insurance spares because everyone insisted “we have to have these.” Profit is unchanged. The cash is gone. 

    Why plant leaders should care 

    This isn’t trivia for the finance team. It’s directly about whether your work gets funded. Three reasons: 

    • Capital approvals depend on cash. If the company is cash-tight, your $500K reliability project can get deferred even when the ROI is excellent. The “no” you heard wasn’t about value. It was about cash. 
    • Inventory decisions are cash decisions. Every reduction in excess work in process or dead MRO is cash handed back to the company. That’s a win you can deliver without selling a single extra unit. 
    • “Save money” sometimes means “free up cash,” not “cut expense.” Knowing which one you’re offering changes how you frame the pitch, and changes who says yes. 

    A story your CFO will love 

    Real-world example: the MRO stockroom cleanup. A plant audits its spare-parts stockroom and finds: 

    • $1.2M of MRO inventory on the books. 
    • $340K of it hasn’t moved in five or more years; obsolete or duplicates. 
    • $180K is for equipment no longer even in service. 

    They sell or write off the obsolete parts and tighten the min and max levels on the rest. The result is about $400K of cash returned to the company. The income statement barely flinches, because write-offs actually sting profit in the short term, but the balance sheet and cash position improve in a big way. 

    That is a story the CFO loves, and notice why: it hurt profit slightly while freeing real cash. If you only spoke the language of profit, you’d never pitch it. Because you understand cash, you can. 

    Try it yourself 

    Walk your stockroom, or pull the MRO inventory report. Then: 

    • Find three line items that look like they haven’t moved in years. 
    • Estimate the dollar value sitting on the shelf. 
    • Ask two questions: do we still own the equipment those parts support, and are they still needed? 

    This is a five-minute exercise that routinely surfaces five- and six-figure cash opportunities hiding in plain sight. 

    Key takeaways 

    • Profit and cash are not the same, and a plant leader needs to be fluent in both. 
    • Inventory ties up cash without touching profit until it moves. 
    • Spare parts strategy is a cash strategy. 
    • When a project gets deferred, it’s often a cash issue, not a value issue. Frame it accordingly. 

    Wrapping up Part 1 

    You now have the foundation: how the business makes money, how to read its statements, and why cash and profit tell different stories. That’s “thinking like the business.” From here on, you can look at anything on your floor and ask the only questions that get things funded. What is this doing to cost, to cash, and to risk? 

    Next, we put that lens to work and go hunting. There’s far more money leaking out of your plant than anyone is tracking, and most of it is hiding in places nobody thinks to look. 


    Coming next, Part 2: Where the Money Hides.

  • Business Acumen: Financial Statements for Operators

    Business Acumen: Financial Statements for Operators

    Financial Statements for Operators 

    You don’t need to read them like an accountant. You need to read them like the person who moves the numbers on them. 

    Say the words “financial statements” in a plant and watch people’s eyes glaze over. Don’t let yours. Here’s the good news: there are only three, and you only need a working understanding of each. Together they answer three plain questions. Is the company healthy? Is it growing? Can it pay its bills? 

    Once you can read these three the way you read a downtime report, the budget conversation stops being intimidating and starts being a place where you have the upper hand. 

    The three statements at a glance 

    Statement  What it tells you  Plant floor translation 
    Income Statement  Did we make a profit over a period of time?  Did we ship more value than we burned in costs? 
    Balance Sheet  What do we own and what do we owe right now?  How much inventory and equipment is sitting around? 
    Cash Flow Statement  Did cash actually come in or go out?  Can we pay vendors, payroll, and capital projects this month? 

    The income statement (the P&L) 

    Read it top to bottom and it tells a story: 

    • Revenue. What we sold. 
    • Minus Cost of Goods Sold (COGS). What it cost to make what we sold: materials, direct labor, manufacturing overhead. 
    • Equals Gross Profit. 
    • Minus Operating Expenses. Sales, general and administrative, R&D, other overhead. 
    • Equals Operating Income (EBITDA). 
    • Minus Interest, Taxes Depreciation and Amortization. 
    • Equals Net Income. 

    Here’s the part that should make you sit up. Almost everything that happens on your floor lands in one line: COGS. Scrap, rework, breakdown overtime, energy, raw material; all of it flows into Cost of Goods Sold. That is why plant performance is one of the most direct ways to move profit in the entire company. You are not a support function on this statement. You are sitting on the biggest lever it has. 

    Real-world example: how one bad week shows up. A bottling plant strings together breakdowns in week 3 of the month. Watch where it lands on the income statement: 

    • Volume drops, so revenue falls about $180,000. 
    • Overtime to catch up pushes COGS labor up $22,000. 
    • Expedited freight to hit customer dates adds $15,000 to COGS freight. 
    • Scrap from startup defects after each restart adds $9,000 in COGS materials. 

    Total profit hit: roughly $226,000 in one week, and most of it stayed invisible until the month closed. 

    That last line is the whole point. The damage was real on the floor in week 3, but nobody felt it on paper until the books closed weeks later. The person with business acumen connects those two moments before the month ends. 

    The balance sheet 

    If the income statement is a movie of a time period, the balance sheet is a photograph taken on a single day. It shows everything the company owns and everything it owes. 

    Assets = Liabilities + Equity 

    What we have = what we owe + what’s left for the owners. 

    Where does the plant show up here? 

    • Inventory. Raw materials, work in process, and finished goods. Every dollar tied up here is a dollar not earning anything else. 
    • Property, Plant and Equipment. Your machines, lines, and building. Their value is depreciated over time. 
    • Spare parts (MRO). Sometimes counted as inventory, sometimes capitalized. Either way, it’s cash sitting on a shelf. 
    • Accounts Payable. What you owe vendors for materials and services you haven’t paid for yet. 

    Notice the tension built into your stockroom. Carry too much “just in case” spare-parts inventory and you tie up cash that could be working elsewhere. Carry too little and you risk extended downtime when a critical part isn’t on hand. There’s no perfect number; there’s a strategy, and we’ll build it in Part 5. 

    The cash flow statement 

    This is the one that trips people up, so I’ll keep it short here and give it the full treatment in the next post. The headline is this: a company can be profitable and still go broke, because profit and cash are not the same thing. The cash flow statement tracks the actual money moving in and out of the bank account, in three buckets: 

    • Operating cash flow. Cash from running the business. 
    • Investing cash flow. Cash spent on, or received from, buying and selling assets like equipment. 
    • Financing cash flow. Cash from loans, investors, dividends, and debt repayment. 

    Hold that thought. The gap between profit and cash is where a lot of good plant decisions live or die, and it’s exactly where we’re headed next. 

    Try it yourself 

    Pull your plant’s last income statement or ask Finance for one. Find: 

    • Total revenue for the period. 
    • COGS. 
    • Gross profit (revenue minus COGS). 
    • Gross margin percentage (gross profit divided by revenue). 

    Then estimate one thing: what happens to gross margin if your plant cuts unplanned downtime by 5%? Even a rough number is fine. The point isn’t precision yet; it’s building the muscle of connecting a floor action to a financial line. 

    Key takeaways 

    • There are only three statements, and you only need a working grasp of each. 
    • Income Statement is the profit story, and COGS is where your floor lands. 
    • Balance Sheet is what you own and owe; inventory, equipment, and spare parts are your footprint on it. 
    • Cash Flow is actual money movement, and profit and cash are not the same thing. 
    • Plant performance moves COGS directly, and COGS moves net income directly. You hold a real lever. 


    Coming next, Part 1, Post 3: Profit vs. Cash, Why They Are Not the Same.

  • Business Acumen: Thinking Like The Business

    Business Acumen: Thinking Like The Business

    How Your Business Actually Makes Money 

    Before you can fix the floor, you have to see the floor the way the business sees it. 

    Most of us came up through the technical side. We learned the equipment, the process, the schedule. What almost nobody handed us along the way was a simple picture of how the whole company actually makes money. And until you have that picture, every financial conversation feels like it’s happening in a language you were never taught. 

    So let’s start there. Forget the org chart for a minute. No matter how complicated your company looks on paper, it runs on the same simple engine. 

    The engine, in plain English 

    A manufacturing business makes money by converting raw materials into finished goods that customers will pay more for than the materials and the conversion cost combined. 

    That difference is your contribution. You pay your fixed costs out of that contribution, and whatever is left is profit. That’s the whole machine. Everything else in this series is just a more detailed look at one part of it. 

    Three ideas make the engine run: how revenue is built, how costs behave, and what’s left over. Let’s take them in order. 

    The three levers of revenue 

    Revenue doesn’t just show up. It gets built from three knobs, and plant decisions touch all three. 

    • Volume. How many units you ship. 
    • Price. What you charge per unit. 
    • Mix. Which products you ship, because some carry higher margins than others. 

    These interact in ways that aren’t always obvious. Push volume by discounting to move product, and your price knob drops; you might end up flat. Ship more of your high-margin products, and revenue can climb even if total units stay the same. When you free up capacity on a constrained line, you’re not just making “more stuff.” You may be changing the mix, and that can matter more than the raw count. 

    How costs behave: fixed versus variable 

    This is the single most important cost concept on the floor, and it’s the one that explains why downtime hurts the way it does. 

    Cost type  Behavior  Plant examples 
    Fixed  Stays the same whether you make 1 unit or 1,000  Building lease, salaried staff, depreciation on equipment 
    Variable  Rises and falls with how much you produce  Raw materials, packaging, energy on running equipment, hourly overtime 

    Here’s why it matters. When a line goes down, you stop spending the variable cost on the units you didn’t make, except for the labor you are paying to stand around. This raises the cost per unit and the fixed cost meter keeps running the entire time the line sits dark. The lease, the salaries, the depreciation; none of it pauses. That’s why every hour of unplanned downtime costs more than people expect. 

    Contribution margin: the number that sizes everything 

    Contribution margin is the money left from each unit sold after you subtract that unit’s variable cost. It’s what’s available to cover fixed costs and other overhead and then turn into profit. 

    Contribution margin per unit = selling price minus variable cost per unit 

    Total contribution = contribution per unit times units sold 

    Remember the packaging line from the intro? Let’s do the full math this time. 

    Worked example: a pet food packaging line. A 30 lb bag sells for $24. The variable cost (kibble, bag, film, energy, direct labor) is $14. So contribution per bag is $10. 

    Plant fixed costs are $400,000 per month. Divide that by the $10 per bag, and your break-even is 40,000 bags per month. Every bag past 40,000 drops a clean $10 to the bottom line. 

    Now a breakdown costs you 5,000 bags this month. If you were already above break-even, your fixed costs were covered, so that $10 per bag was pure profit. Five thousand bags times $10 is $50,000 of profit gone. Not revenue. Profit. And you’ll never get it back. 

    That’s the move that gets your projects funded. Anyone can say “the line was down for a shift.” The person with business acumen says “that shift cost us $50,000 in profit,” and suddenly the room is paying attention. 

    Break-even thinking 

    Break-even units = fixed costs divided by contribution margin per unit 

    Once you know your break-even point, the picture gets sharp. Every unit above it is profit. Every unit below it is a loss. This is also why a plant running close to break-even feels every disruption so hard; there’s no cushion of profitable volume to absorb the hit. The closer you operate to that line, the more expensive each lost unit becomes. 

    Try it yourself 

    Pick one product line in your plant. Estimate these, or ask Finance: 

    • Selling price per unit. 
    • Variable cost per unit. 
    • Total monthly fixed cost allocated to that line. 

    Then calculate: 

    • Contribution margin per unit (price minus variable cost). 
    • Break-even units per month (fixed cost divided by contribution margin). 
    • How many units above break-even you shipped last month. That’s your profit contribution. 

    If you don’t know these numbers, that’s not a failure. That’s the first finding of the exercise, and it’s exactly the gap this series is here to close. 

    Key takeaways 

    • Revenue is moved by volume, price, and mix, and plant decisions touch all three. 
    • Fixed costs run no matter what you produce. That’s why downtime is so expensive. 
    • Contribution margin is the single most important number for sizing the impact of a loss. 
    • Every unit above break-even is profit. Every unit below it is bleeding.

    Coming next, Part 1, Post 2: Financial Statements for Operators. 


  • Business Acumen for Manufacturers

    Business Acumen for Manufacturers

    The gap nobody warns you about, and the series that closes it 

    In all my years of turning plants from reactive to profit-producing, I’ve found a handful of gaps that show up again and again, and they don’t seem to care what industry you’re in. Food, chemicals, metals, packaging, pulp and paper; the same gaps are waiting in every plant I walk into. 

    The biggest one is leadership constraint. That’s a series for another day. 

    The close second is business acumen, and it’s the one almost nobody sees coming. It’s hidden. Most people don’t know it exists, let alone know they need it. They were promoted because they were good at the technical work. They could fix the line, run the schedule, hit the numbers. Then one day someone in a meeting asked, “Okay, but what does that do to EBITDA?” and the room went quiet. 

    If you’ve ever been in that room, this series is for you. 

    What business acumen actually is 

    Let’s clear something up right away: business acumen is not an accounting class. You don’t need a finance degree, and you don’t need to love spreadsheets. 

    Business acumen is the ability to look at what’s happening on your floor and understand what it’s doing to cost, cash, and risk, and then make decisions accordingly. It’s the bridge between a leaking gearbox and a board meeting. It’s what lets you walk into a budget conversation and say, in language leadership actually funds, “This failure mode is costing us $50,000 a month in lost profit, and here’s the fix that pays for itself in eleven weeks.” 

    That’s the difference between being the person who asks for money and being the person who makes the case for it. 

    Here’s the part that surprises people most: you already have the data. The downtime logs, the work orders, the scrap reports, the parts usage; it’s all sitting in your systems right now. What’s missing isn’t data. What’s missing is the skill to translate that data into the three things every business actually cares about: cost, cash, and risk. 

    That skill is learnable. That’s what this series is about. 

    Why this gap is so expensive 

    When a line goes down, most people instinctively think about lost revenue. But revenue isn’t what disappears. Profit is. 

    Picture a packaging line. A bag of product sells for $24, and the variable cost to make it (materials, film, energy, direct labor) is $14. That leaves $10 of contribution on every bag. Now a breakdown costs you 5,000 bags this month. That’s not $120,000 of revenue gone, and it’s not even the $50,000 of contribution you’d guess at first glance. Once you account for the fixed costs that kept running the whole time the line sat dark, the hit to the bottom line is real money you’ll never get back. 

    The technician who can see that math, and explain it, gets their projects funded. The one who can’t gets told “no budget this quarter” and watches the failure repeat. 

    That’s the cost of the acumen gap. It’s not abstract. It shows up in every deferred repair, every under-resourced reliability program, and every good idea that died because it was pitched in the wrong language. 

    How this series is built 

    We’re going to break business acumen into six parts, with multiple posts under each. We’ll go in order, because the parts build on each other; but each post will stand on its own so you can jump to what you need. 

    Part 1: Thinking Like the Business. Before you can fix the floor, you have to see the floor the way the business sees it. How your company actually makes money, the financial statements that matter, and why profit and cash are not the same thing. 

    Part 2: Where the Money Hides. Money leaks out of a plant in far more places than most people track. We’ll map out exactly where it’s hiding, across equipment, people, and resources, so you stop guessing and start finding it. 

    Part 3: Measuring What Matters. You can’t fund what you can’t size. This is where you learn to measure the bleeding, to put a real number on a loss instead of a gut feeling, and where to focus first. 

    Part 4: Building the Business Case. This is the financial language that gets things funded: cost-benefit analysis, payback, ROI, and the silent killer almost nobody quantifies, the cost of inaction. 

    Part 5: Connecting Reliability to Profit. Here’s where it all comes together at the strategic level: throughput thinking, working capital and spare parts, and how maintenance stops being a cost center and starts being a profit lever. 

    Part 6: Acumen in Action. The capstone. Making decisions and tradeoffs under real constraints, translating technical findings into business language, and putting the whole picture to work in your next staff meeting. 

    A promise before we start 

    Every formula and idea in this series has been kept as simple as it can be while still being honest. If a CFO would scoff at it, it’s not here. If a frontline supervisor wouldn’t understand it, it got rewritten. 

    Simplicity is not the enemy of rigor. It’s the price of being heard. 

    If you can talk about cost, cash, and risk in the same sentence as your equipment, you’re already doing it right. By the end of this series, that won’t feel like a stretch. It’ll feel like how you think. 

    Let’s get to work. 

    Coming next, Part 1, Post 1: How Your Business Actually Makes Money. 

  • The High Cost of Lean at the Wrong Maturity Level

    The High Cost of Lean at the Wrong Maturity Level

    Walk into almost any plant with an active continuous improvement program and you will find a portfolio of lean tools in deployment. Value stream mapping, kaizen events, SMED, 5S, standard work, visual management, and sometimes a kanban system or a set of Six Sigma DMAIC projects layered on top. The CI manager has a roadmap, the lean coordinator has a calendar full of events, and the team is busy.

    Busy is not the same as effective.

    There is a quiet failure mode in continuous improvement programs that appears in many organizations. Lean tools are often deployed at a moment when the operation is not mature enough to benefit from them. The tools themselves are not incorrect, and they are frequently executed with technical precision. When they are applied before the underlying operation is doing the right things, the result is a system that performs the wrong activities with greater speed and consistency.

    This article focuses on that sequencing challenge and explains why effectiveness must always precede efficiency in every operation.

    What Lean Is Actually For

    Lean is fundamentally the systematic removal of waste. This principle shaped the Toyota Production System, reflected the direction Henry Ford was already pursuing a generation earlier, and remains the foundation of every legitimate lean tool in use today.

    The eight wastes that practitioners recite so often are simply variations of the same idea. Organizations must identify activity that does not add value to the customer, remove it, streamline what remains, and continue that cycle with discipline.

    When lean is applied at the correct moment, it becomes transformational. It elevates mature operations into truly excellent ones, reveals capacity that was previously hidden inside the friction of daily work, and removes real cost from the business.

    When lean is applied at the wrong moment, it produces a very different outcome.

    The Failure Mode: Efficient Wrong Things

    A process that does not deliver the correct outcome can be mapped, streamlined, standardized, balanced, and improved through a series of lean events. Cycle time will fall, variation will tighten, and the team will celebrate the visible gains. The underlying operation, however, will not be meaningfully better.

    A classic example is a maintenance organization that operates reactively. Work orders arrive unplanned, parts are expedited, jobs are rushed, equipment fails again, and the cycle repeats. A lean team may map the value stream of this reactive work and remove waste from the process. Technicians will reach broken equipment faster, parts will be staged more effectively, and the workflow will appear more organized.

    The organization will now have a highly efficient reactive maintenance function, which is still a reactive maintenance function. The losses being optimized were never meant to be optimized. They were meant to be eliminated through a shift to proactive maintenance. Lean has made the organization better at the wrong thing.

    This pattern appears in every domain. A quality team that relies on end‑of‑line inspection can make the inspection process more efficient, although the correct move is to improve the upstream process so inspection becomes unnecessary. A planning function that spends most of its time expediting can streamline the expediting process, although the correct move is to plan further ahead so expediting is no longer the dominant mode. An operations team that performs constant changeovers due to poor scheduling can reduce changeover time through SMED, although the correct move is to consolidate the schedule.

    In each case, lean produces measurable results, yet the fundamental issue remains untouched. In some organizations, early lean deployment even reinforces the wrong process by making it appear optimized and acceptable.

    The Curve You Are Trying to Climb

    Improvement does not follow a straight line. It follows a curve.

    When an operation is underperforming because it is doing the wrong things, missing essential disciplines, or lacking mature core processes, the improvement potential from becoming effective is enormous. A reactive plant that becomes proactive experiences significant gains. A plant with no planning function that builds one experiences significant gains. A plant with no precision standards that adopts them experiences significant gains. These are the high‑leverage moves that come from improving effectiveness.

    Eventually, the major effectiveness gains are exhausted. The plant begins doing the right things consistently. The remaining losses are smaller, more subtle, and more deeply embedded in the flow of work. This is the point where the curve flattens, and efficiency becomes the primary lever. Lean tools are designed for this stage, when the operation is mature and the remaining waste is difficult to detect.

    The mistake occurs when organizations reach for lean while they are still on the steep part of the effectiveness curve. They trade large, fundamental gains for small, incremental ones. They invest time, resources, and credibility into lean events that produce modest improvements while ignoring the foundational changes that would produce step‑change performance.

    Effectiveness must come first. Efficiency must follow. The order is not optional.

    How to Tell Which Phase You Are In

    If you are unsure whether your operation is ready for serious lean deployment, consider the following questions.

    Are you doing the right things, defined by current best practice in your industry? This is not a question about effort or activity. It is a question about whether the disciplines, methodologies, and processes that produce excellent outcomes are present and functioning.

    Have you closed the obvious gaps? Major discipline gaps such as the absence of a planning function, a predictive program, operator care, work execution standards, or asset criticality analysis are effectiveness issues. Lean will not fix them.

    Are your remaining losses small, difficult to identify, and challenging to eliminate? This is a signal that lean is appropriate. The operation has matured, the obvious moves are complete, and the remaining waste is buried in well‑functioning processes.

    Do improvements sustain over time? Sustainability is a prerequisite. If basic disciplines erode within months, lean improvements will erode as well. The foundation must be stable before efficiency tools can take hold.

    If the honest answer to the first three questions is no, the organization is not ready for lean as the primary improvement lever. The focus must shift to effectiveness, capability building, and closing foundational gaps. Lean remains in the toolkit, although it should not lead the strategy.

    If the answer to the first three questions is yes, lean becomes the correct next step. The major effectiveness gains are behind you, and the remaining waste requires the precision of lean methods.

    What This Means for Your CI Strategy

    Several practical implications follow from this understanding.

    Sequence effectiveness work before lean work. Plants that begin from a reactive or under‑disciplined state should focus their initial improvement portfolio on building the right capabilities rather than running lean events against immature processes.

    Do not confuse activity with progress. A full CI calendar is evidence of activity, not improvement. Outcomes matter more than events.

    Match the tool to the maturity of the operation. Capability‑building methodologies such as RCM, planning and scheduling, criticality analysis, operator care, predictive maintenance, and standard work development belong on the steep part of the curve. Lean and Six Sigma belong on the flatter part. Use them in that order.

    Audit your CI portfolio for misapplied tools. Evaluate each initiative and determine whether it makes the organization better at doing the right thing or more efficient at doing the wrong thing. The answer determines whether the project belongs.

    Build lean capability in advance of when you will need it. This is not an argument against lean. It is an argument for sequencing. Train your people, build the skill, and develop the toolkit so it is ready when the operation reaches the appropriate level of maturity.

    The Bottom Line

    Lean is one of the most powerful improvement disciplines ever created. It elevates mature operations into elite performers and removes real cost from well‑functioning businesses. The principles are sound, the tools are excellent, and the methodology has earned its reputation.

    Timing determines the outcome. A powerful tool deployed at the wrong moment delivers the wrong result. Lean applied before effectiveness creates efficient bad processes. Lean applied after effectiveness creates excellent ones.

    Start with effectiveness. Establish the right disciplines. Mature the operation. Then apply lean to what remains and watch it deliver exactly what it was designed to deliver.

    Right thing first. Right thing efficiently second. Always in that order.

    If your organization is ready to move from activity to real progress, contact us to discuss how we can help you build the right foundation and deploy the right tools at the right time. Contact us today!