Author: Anjelica

  • Clean to Inspect for Best in Class Operator Care

    Clean to Inspect for Best in Class Operator Care

    Cleaning is an important first step in Operator Care and reliability gains because:

    • Insufficient cleaning causes losses and
    • The cleaning activity itself exposes hidden defects

    Dirt in rotating parts, sliding parts, pneumatic and hydraulic systems, electrical and control systems, sensors, etc. causes malfunctions, reduce function, failure by wear, clogging, resistance, speed losses, etc. are different types of defects. Defects are anything that is abnormal from the expected ideal condition. Insufficient cleaning causes forced deterioration. All these losses are solved through a thorough cleaning of equipment and countermeasures to keep the equipment clean.

    Defect Identification while cleaning

    Since the key reason for cleaning is to identify abnormalities while cleaning, it is important to understand how to do this. Abnormalities will be found both while cleaning and ideally while the line is running since many abnormalities are undetected when the equipment is down. Anyone can find an abnormality through the use of their senses (touch, smell, see, hearing). Individuals on the team should become like human sensors. This thorough approach increases the chances of detecting hidden abnormalities such as abnormal vibration, noise, odor and overheating just to mention some. (Notice all of these can only be detected during equipment operations)

    Today, many defects are hidden because the equipment is dirty. Equipment inspections fail to expose these “hidden” defects. By cleaning the equipment thoroughly, we expose every defect. The key concept is: Cleaning is Inspection. When we clean, we touch every part of the equipment and therefore inspect every part of the equipment. The analogy that is often used to describe this idea is that of washing your car. When you wash your car by hand, you see every dent & scratch.

    This “inspection by cleaning” process is part of the daily work while operating the equipment. This skill is developed, practiced, and improved and it becomes part of daily work and is used throughout the entire plant.

    Teams should expect to reduce losses as a result of their Operator Care activity. Daily equipment loss data provides the picture of current and ongoing losses. Priority can be put first on that part of the equipment that experiences the most losses.

    Ongoing, daily data can then be used to:

    • Assess loss elimination progress
    • Review failures as they occur
    • Focus the daily cleaning and inspection activities

    Daily data should include things such as: Number of touches (the amount of times a person has to physically do something to keep the equipment running as designed), Number of minor stops, breakdowns, etc.

    As they review the data, teams should ask themselves the following questions:

    • Should our activities have prevented the loss?
    • Was the loss caused by insufficient cleaning?
    • Was there a problem we should have detected while cleaning, but failed to see?
    • Are we cleaning and inspecting the right areas?
    • If we found a problem did, we fix it in time, or was it fixed incorrectly?
    • Is the cleaning we are doing having no effect on the operation of the equipment?
    • Are we cleaning items more frequently than needed to maintain ideal?

    From this assessment, the team should adjust their work.

    They may need to:

    • Focus their cleaning to inspect in critical areas
    • Adjust how they are handling the problems they find
    • Obtain some training on how to detect the type of problems that are causing the losses they have

    Cleaning sounds easy but here are a few things to think about before you start cleaning:

      1. Preparation:

    Most deep cleaning will require the operation to be down which means preparation is critical. The boundaries of the Operator Care activity need to be clear; before pictures should be taken, cleaning supplies(rags, cleaning solution) and tools should be available; safety maps and risk prediction forms should be available, MSDS’s should be reviewed for the cleaning solutions to be used.

      1. Cleaning techniques:

    First of all, the most contaminated areas must be cleaned thoroughly. Following some tips to be considered during cleaning:

      1. Clean from top to bottom, center to outside in order to keep already clean areas clean.
      2. Touch every part of the equipment
      3. Lids and safety panels must be opened and internal parts of the machine inspected, cleaned, and checked for looseness of bolts, screws, nuts, photo-eyes, etc.
      4. Clean all auxiliary parts of the machine
      5. All objects near the machine that are not necessary must be eliminated.
      6. Closing out the cleaning activities:

    3. After the team has completed the cleaning activity it is important that before they leave the area they:

      1. Check the area for tools, trash, etc.
      2. Capture after pictures
      3. Put supplies away
      4. Perform a test run

    4. Turnover of cleaning activities to line operations:

    At the end of a cleaning session, it is important to make sure that the equipment is ready for operation. A summary of the teams’ activities should be provided to the oncoming team in case issues arise later. Cleaning activities should not cause any type of loss to the line.

    1. The Cleaning should take place at the end of the shift with the goal of setting the next shift up for success.

    And finally, keep a record of how much time your team is cleaning. All cleaning time is a loss; ideal is 0. Any progress to eliminate effort loss on keeping the machine clean should be captured.

  • Asset Management Systems for Small Groups

    Asset Management Systems for Small Groups

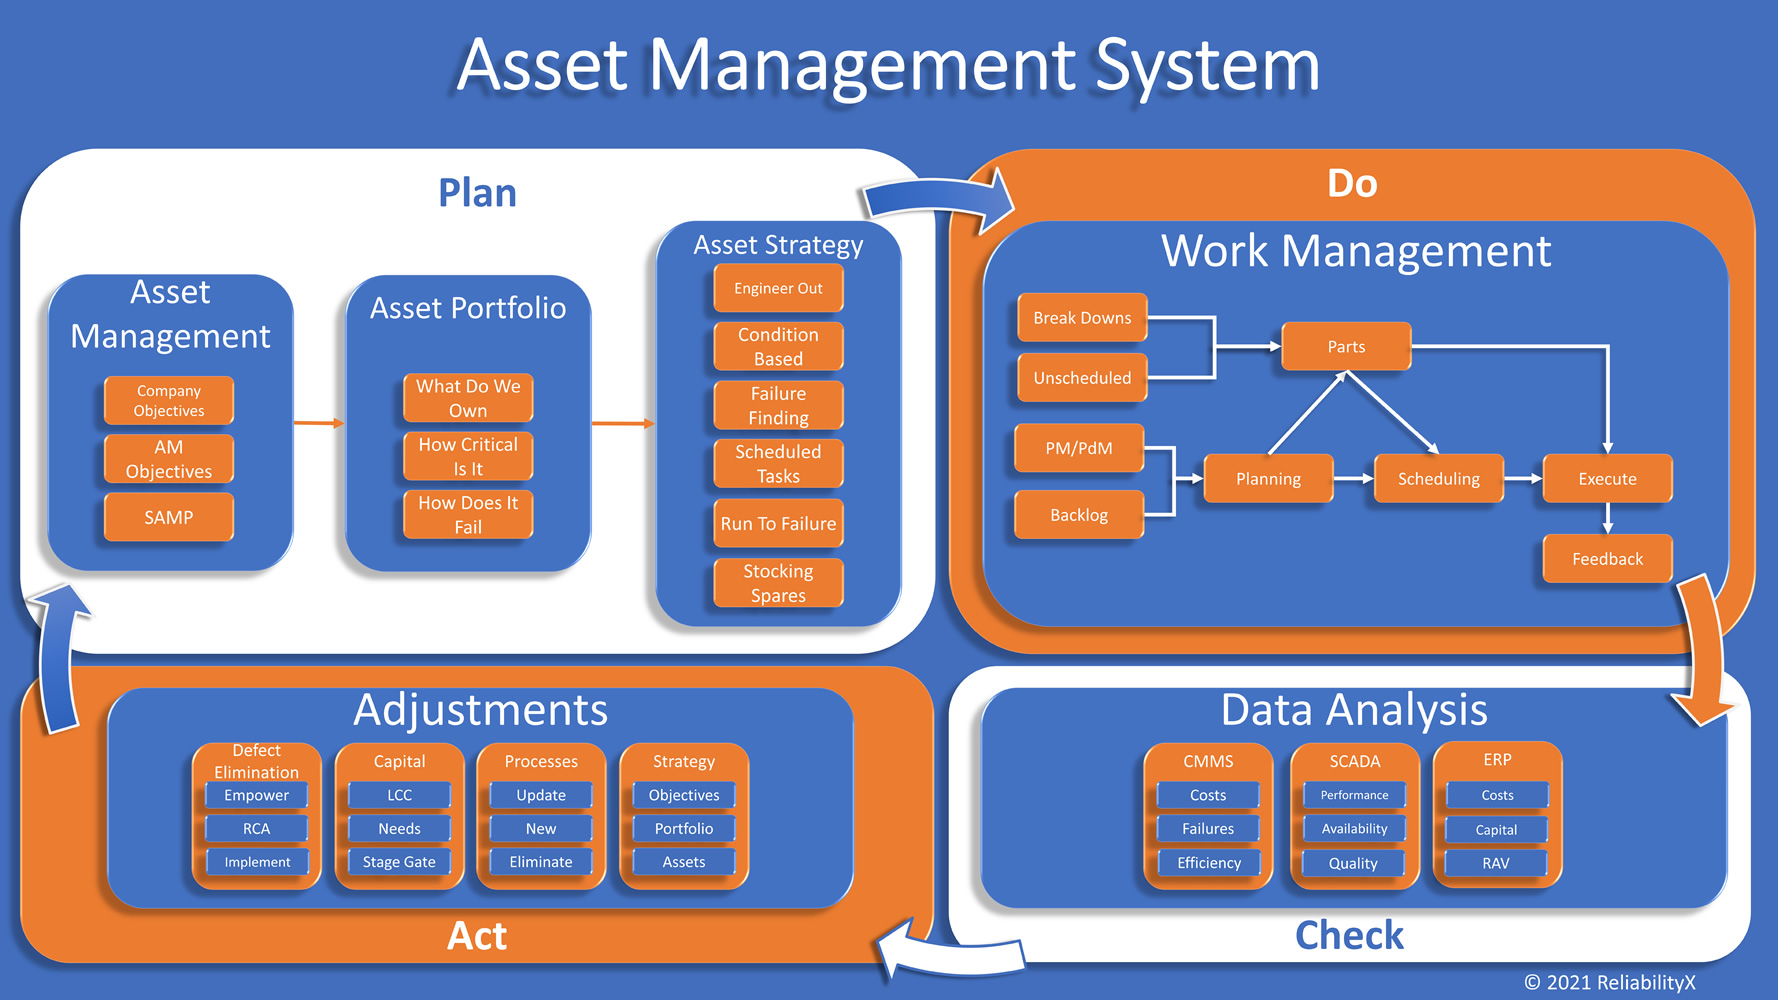
    An asset management system is comprised of all of the necessary processes, procedures, tools, systems, and methods necessary to meet business objectives in a manner which is controlled, measured, and improved upon.  The system, more often than not, takes on some visual representation as in the graphic below.  The purpose is to provide a simplified understanding of the overall process to meet asset management goals.

    The utilization of such a system generally allows an organization to develop standardized methods, train on those methods, and measure against the use and success of the methods.  These steps are typically seen as unnecessary or overkill to smaller organizations. Afterall, if you are the maintenance manager in control of 6 multi-craft technicians, why would you put in all the effort to utilize an asset management standard?  What benefit would such a small group see?

    Regardless of the size of the maintenance team, and asset management system can offer similar benefits.  In smaller teams, the asset management system may be less complex in the level of detail necessary to maintain control of the system but is it just as important to have control.  The asset management system’s level of detail should provide an organization with the ability to identify the right work against the right assets at the right time to ensure continued operation and achievement of company goals.  “Right” indicates understanding of what is important, what needs to be done, and how it will be completed.

    If you are the maintenance manager with a small team developing and implementing an asset management system may seem like a monumental task.  Afterall, you have a day job.  How can you develop the system, procedures, and tools necessary to implement?  I recommend starting with understanding.  There are many resources online and in books to help you understand the asset management system and component processes.  Do some research and find approaches to these elements which provide the right level of detail for your organizational size.  Remember, the goal is to create standards for the various components, not to make them overly complex.  You can improve them over time as necessary and as you mature as a group.

    Good luck!!

  • RCFA…What is the Problem?

    RCFA…What is the Problem?

    In all the years of facilitating RCFA, what seems like the easiest part has proven to be one of the most challenging.  Documenting the problem statement.  It is human nature is to immediately develop an opinion and provide a solution.  When a group of people are put in a room together for an RCFA they immediately believe they are there to solve THE problem.  This leads to a focus on solutions to the event as it occurred.  The team gathers in the room and the facilitator asks what the problem statement is, and the replies tell it all.  “Jane, the operator, hit the wrong button.”  “The technician didn’t know how to install the bearing.”  “Poor lubrication.”  Sound familiar?

    While these will likely end up on your RCFA as causal factors in some way, they are not problem statements.  When constructing the problem statement there are a few things to consider.  First, the problem statement should be directly tied to business goals.  For example, “loss of production” or “Safety risk elevated”.  The goal is to be simple in the problem statement and reduce the amount of time trying to document it.  Too much time is often spent trying to articulate a problem statement which includes a causal factor that people believe to be the root cause.  This takes away time to map out your causal factors and get to latent and systemic layers in the allotted time.

    Additional details regarding a specific event or recurrent event should also be documented.  These attributes may include:

    • Date(s) of event
    • Relative timing (shift, season, etc.)
    • Number of actual occurrences if applicable
    • Cost to the business per event
    • Safety impact per event
    • Quality impact per event
    • Maintenance impact per event

    Documenting these details helps to understand the total business impact of either individual or recurring events and provides better clarity into what can be invested to help eliminate or reduce probability of reoccurrence.  These details while not part of the problem statement, are part of the problem details.

    So, keep your problem statement short, sweet, and connected to business impact.  Document problem details so you have better understanding of total impact.  And, save some time which can be better utilized getting into the detailed causal factors.

  • Understanding Plant Losses

    Understanding Plant Losses

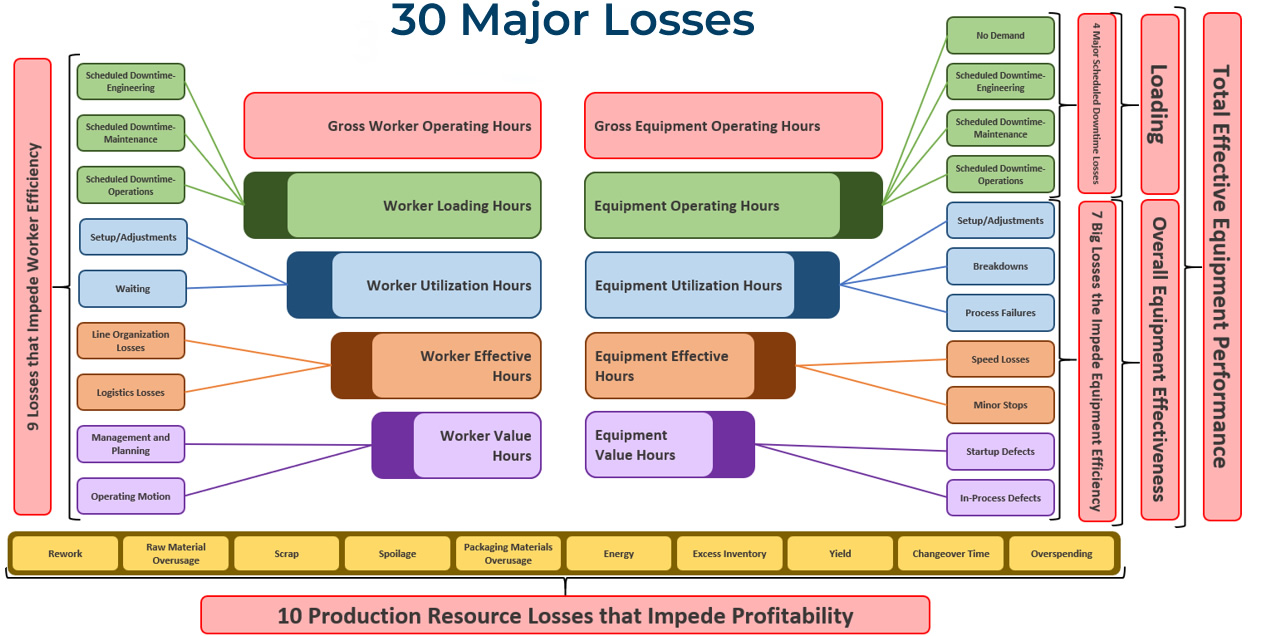
    The Way Losses are Calculated
    and OEE/TEEP Calculation

    In order to get a broad, clear picture of where to focus, you have to view your whole plant as a large system of fully manageable processes. No matter your role, your job is to improve plant processes, helping to produce the highest quality product, at the lowest price possible, in the safest manner. In order to see this big picture, you have to be honest and expose true problems within your facility. From that perspective, you will be able to recognize the different types of losses in your plant and how to secure significant gains in productivity by controlling those losses.

    How to determine where to focus

    The examples in this article use weekly numbers, but the same analysis can and should also be applied monthly, quarterly, and annually. Here we will look at how we apply metrics to some of the different loss types. Armed with an understanding of how your plant is losing productivity and how to measure those losses, you can effectively increase profitability. Let’s look at a few areas of loss.

    Available Time To Produce (Loading)
    1. First, you figure all scheduled downtime. Remember your buckets and put time scheduled in each of the buckets: Changeovers, Engineering Planned Shutdown, Maintenance Planned Shutdown, Operations Planned Shutdown, or No Customer Orders.
    2. Add them all together to come up with your Scheduled Downtime.
    3. Then subtract that from total hours in a week (168 hours available).

    Example: (Planned Maintenance of 24 hours) + (Changeovers of 4 hours) = 28 hours of scheduled downtime.
    (168 hours in a week) – (28 hours Scheduled Downtime) = 140 hours available to produce.

    Loading Calculation: (140 scheduled production hours) / (168 hours in a week) = 83%

    This gives you your Available Time To Produce, 140 hours per week or 83%.

    Quality Rate

    Start by taking your startup rejects and your in-process rejects, add them together, then subtract that value from your total units produced.

    Example: (35 Startup Rejects) + (35 In-Process Rejects) = 70 Rejects.
                   7,070 Total Units Produced.
    7,070 70 = 7,000 Good Units Produced.

    Quality Rate Calculation: (Good Units Produced) / (Total Units Produced) or 7,000 / 7,070 = 99%

    Net Good Processing Hours

    Find your Net Good Processing Hours by dividing your Average Weekly Throughput by your Weekly Design Rate.

    Example: Average Weekly Rate is 7,000 units produced.
    Weekly Design Rate is 100 units per hour.
    7,000 / 100 = 70 Net Good Processing Hours.

    Then, divide your Net Good Processing Hours by your Available Time To Produce.

    Example:  Available Time To Produce is 140 hours weekly.
    70 Net Good Processing Hours / 140 Available Hours To Produce = 50%

    Net Good Processing Hours Calculation: (Average Weekly Rate) / (Weekly Design Rate)
    That is, (Weekly Units Produced) / (Weekly Design Units per Hour)

    Availability

    Begin by taking your Average Breakdown Downtime, Process Failure Downtime and Set/Adjustment Downtime, adding them together, then subtracting the total from the Available Time To Produce.

    Example: (13 hours of Breakdowns) + (1 hour of Process Failures) + (1 hour of Setup/Adjustment) = 15 hours downtime
    (140 hours Available Time To Produce) (15 hours Downtime) = 125 hours Availability per week

    Availability Calculation: (125 hours Availability) / (140 hours Available Time To Produce) = 89% Availability

    Performance

    First, take your Actual Weekly Run Rate and subtract it from the Weekly Design Rate.

    Example: (Weekly Design Rate of 100 per hour) (Actual Weekly Run Rate of 85 per hour) = 15 units per hour lost.

    To convert that loss to hours, divide the Actual Weekly Run Rate by the Weekly Design Rate, subtract that quotient from 100, then multiply that difference by the Availability (in hours per week).

    Example: ( 100 (Actual Weekly Run Rate) / (Weekly Design Rate) ) x (Weekly Availability)
    ( 100 (85 units/hr / 100 units/hr) ) x (125 hours available to produce) = 19 hours in speed losses

    Now, subtract the hours in Speed Losses from the Weekly Availability hours to get Available Time To Produce.

    Example: (125 hours Weekly Availability) (19 hours in Speed Losses) = 106 hours Available Time To Produce.

    To find minor stops, subtract your Net Good Processing Hours from your Available Time To Produce.

    Example: (106 hours Available Time To Produce) (70 hours Net Good Processing Hours) = 36 hours of minor stops per week.

    Performance Calculation: (Speed Losses + Minor Stops) / Weekly Availability
    (19 hours in Speed Losses + 36 hours in Minor Stops) / (125 hours Weekly Availabilty)
    (19 + 36) / 125 = 56% Performance

    OEE/TEEP Calculations: OEE = Availability * Performance * Quality
    OEE = 89% * 56% * 99% = 49%
    TEEP = Loading * OEE     (Loading = Percentage Available Time To Produce)
    TEEP = 83% * 49% = 41%

    7 Big Losses: Minor Stops: 36 hours per week
    Speed Losses: 19 hours per week
    Breakdowns: 14 hours per week
    Process Failures: 1 hour per week
    Setup/Adjustment Losses: 1 hour per week
    Quality Startup Losses: 0.5 hour per week
    Quality In-Process Losses: 0.5 hour per week

    If these were your numbers, where would you focus?

  • Why Do We Not Want Help?

    Why Do We Not Want Help?

    In many dealings throughout my career, including myself, it seems common place that people do not want to admit the need for help. From physically, mentally, in life, or in business, our ego’s seem to always keep us from reaching our full potential.

    As It Relates to Business

    When it comes to business world, why do we allow ego to kill our businesses? Truly successful people understand their need for help. They understand what their gaps are and the need to use others to close them. Outside help is the help that is normally needed. If the organization had the internal knowledge and skills, they would have driven the needed improvements. The exception is if you have superstars that you know are some of the best in the industry working for you already, but you have pushed them to the side, maybe you need to unleash them on the organization. In my opinion, there are three main reasons as to why people do not ask for help and/or any combination of the three.

    Ego

    9 times out of 10 the cause of ego is due to a lack of knowledge. People with ego believe that they know more than they actually do, which creates an overconfidence in their abilities. Einstein’s Theory of Knowledge states that Ego = 1/knowledge. In other words, the more knowledge you have, the more you realize you do not know, thus, less ego.

    Fear

    Fear normally ties to ego. It is the fear of looking incompetent due to the lack of knowledge which would drive the need for help but is refused. People fear looking like they cannot do a certain task or job. It makes them fell inferior and that is not a feeling that people like to experience. Great leaders understand that they need the help, which is why they are successful.

    Cost

    To understand the cost of help, most people look at this backwards. They look at bringing in help as an expense, not an investment. For example, if I were contracted to do work for $100k, people look at the $100k and say that it is expensive. What if you looked at it as an investment, understand that you will provide a return much greater to the organization. If I were to help you resolve issues that are troubling your organization, it is possible to get a 10 to 50 time’s investment or even more! The best of all is the fact that you are now the hero.

    My Growth

    My growth took off exponentially when I realized I did not know everything and I reached out for help. I spent many years thinking that I was the best, and I was, at managing the reactive state of maintenance. I had no concept of proactive maintenance. I just knew that my job was to keep the plant running, and I did just that. Working 20 hour days was my responsibility.

    The Defining Moment

    One day, as we were working on the implementation of a CMMS system, I met a gentlemen that told me everything that I was doing was of truly no benefit. He sat me down and walked through some of the things I should have been doing and what I should not have been doing. He told me what I needed to hear, not what I wanted to hear. In my current state of immaturity, it made me mad, but I also new that he was only trying to help me. I told him I wanted to be the best, so if he could help me than I am all ears. He did just that. He loaded me down with books, answered my questions, and taught me things that I had no clue about. It began to open my eyes of this larger world that exists, and that is when I realized that I did not know anything, compared to what I thought I knew. From that point forward I began hiring anyone from the outside that I could to help me overcome my gaps, my weaknesses and help develop my strengths.

    Question

    What are some reasons as to why we think we do not need help?