Understanding Plant Losses
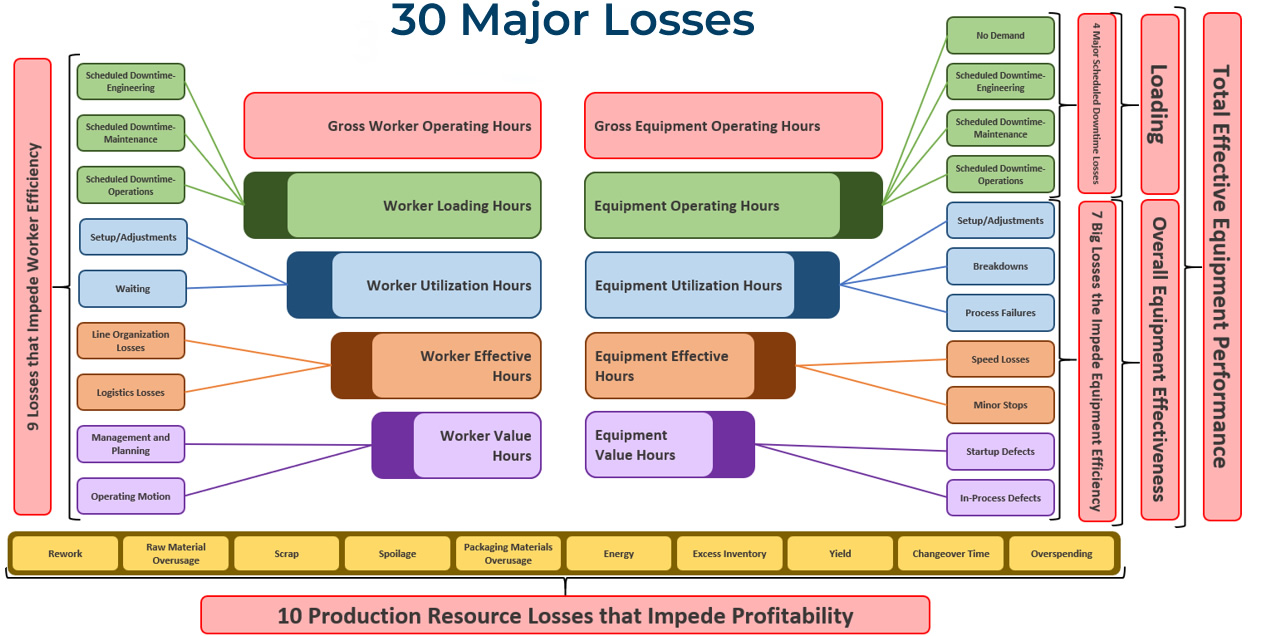
The Way Losses are Calculated
and OEE/TEEP Calculation
In order to get a broad, clear picture of where to focus, you have to view your whole plant as a large system of fully manageable processes. No matter your role, your job is to improve plant processes, helping to produce the highest quality product, at the lowest price possible, in the safest manner. In order to see this big picture, you have to be honest and expose true problems within your facility. From that perspective, you will be able to recognize the different types of losses in your plant and how to secure significant gains in productivity by controlling those losses.
How to determine where to focus
The examples in this article use weekly numbers, but the same analysis can and should also be applied monthly, quarterly, and annually. Here we will look at how we apply metrics to some of the different loss types. Armed with an understanding of how your plant is losing productivity and how to measure those losses, you can effectively increase profitability. Let’s look at a few areas of loss.
Available Time To Produce (Loading)
- First, you figure all scheduled downtime. Remember your buckets and put time scheduled in each of the buckets: Changeovers, Engineering Planned Shutdown, Maintenance Planned Shutdown, Operations Planned Shutdown, or No Customer Orders.
- Add them all together to come up with your Scheduled Downtime.
- Then subtract that from total hours in a week (168 hours available).
Example: (Planned Maintenance of 24 hours) + (Changeovers of 4 hours) = 28 hours of scheduled downtime.
(168 hours in a week) – (28 hours Scheduled Downtime) = 140 hours available to produce.
Loading Calculation: (140 scheduled production hours) / (168 hours in a week) = 83%
This gives you your Available Time To Produce, 140 hours per week or 83%.
Quality Rate
Start by taking your startup rejects and your in-process rejects, add them together, then subtract that value from your total units produced.
Example: (35 Startup Rejects) + (35 In-Process Rejects) = 70 Rejects.
7,070 Total Units Produced.
7,070 – 70 = 7,000 Good Units Produced.
Quality Rate Calculation: (Good Units Produced) / (Total Units Produced) or 7,000 / 7,070 = 99%
Net Good Processing Hours
Find your Net Good Processing Hours by dividing your Average Weekly Throughput by your Weekly Design Rate.
Example: Average Weekly Rate is 7,000 units produced.
Weekly Design Rate is 100 units per hour.
7,000 / 100 = 70 Net Good Processing Hours.
Then, divide your Net Good Processing Hours by your Available Time To Produce.
Example: Available Time To Produce is 140 hours weekly.
70 Net Good Processing Hours / 140 Available Hours To Produce = 50%
Net Good Processing Hours Calculation: (Average Weekly Rate) / (Weekly Design Rate)
That is, (Weekly Units Produced) / (Weekly Design Units per Hour)
Availability
Begin by taking your Average Breakdown Downtime, Process Failure Downtime and Set/Adjustment Downtime, adding them together, then subtracting the total from the Available Time To Produce.
Example: (13 hours of Breakdowns) + (1 hour of Process Failures) + (1 hour of Setup/Adjustment) = 15 hours downtime
(140 hours Available Time To Produce) – (15 hours Downtime) = 125 hours Availability per week
Availability Calculation: (125 hours Availability) / (140 hours Available Time To Produce) = 89% Availability
Performance
First, take your Actual Weekly Run Rate and subtract it from the Weekly Design Rate.
Example: (Weekly Design Rate of 100 per hour) – (Actual Weekly Run Rate of 85 per hour) = 15 units per hour lost.
To convert that loss to hours, divide the Actual Weekly Run Rate by the Weekly Design Rate, subtract that quotient from 100, then multiply that difference by the Availability (in hours per week).
Example: ( 100 – (Actual Weekly Run Rate) / (Weekly Design Rate) ) x (Weekly Availability)
( 100 – (85 units/hr / 100 units/hr) ) x (125 hours available to produce) = 19 hours in speed losses
Now, subtract the hours in Speed Losses from the Weekly Availability hours to get Available Time To Produce.
Example: (125 hours Weekly Availability) – (19 hours in Speed Losses) = 106 hours Available Time To Produce.
To find minor stops, subtract your Net Good Processing Hours from your Available Time To Produce.
Example: (106 hours Available Time To Produce) – (70 hours Net Good Processing Hours) = 36 hours of minor stops per week.
Performance Calculation: (Speed Losses + Minor Stops) / Weekly Availability
(19 hours in Speed Losses + 36 hours in Minor Stops) / (125 hours Weekly Availabilty)
(19 + 36) / 125 = 56% Performance
OEE/TEEP Calculations: OEE = Availability * Performance * Quality
OEE = 89% * 56% * 99% = 49%
TEEP = Loading * OEE (Loading = Percentage Available Time To Produce)
TEEP = 83% * 49% = 41%
7 Big Losses: Minor Stops: 36 hours per week
Speed Losses: 19 hours per week
Breakdowns: 14 hours per week
Process Failures: 1 hour per week
Setup/Adjustment Losses: 1 hour per week
Quality Startup Losses: 0.5 hour per week
Quality In-Process Losses: 0.5 hour per week
If these were your numbers, where would you focus?