Category: Financials

  • The Financial Competitive Advantage of Reliability

    The Financial Competitive Advantage of Reliability

    The Financial Competitive Advantage of Reliability 

    Reliability is more than just a technical goal; it is a strategic financial advantage. Organizations that prioritize reliable assets, equipment, and operations outperform competitors by reducing costs, improving efficiency, and maximizing return on investment (ROI). 

    Reliability-driven companies experience lower maintenance costs, higher production efficiency, and increased profitability. When reliability is built into operations, businesses gain a sustainable financial edge that allows them to reinvest in growth and innovation. 

    How Reliability Creates Financial Competitive Advantage 

    Reliability impacts an organization’s financial performance in multiple ways, including: 

    • Lowering maintenance costs through proactive strategies. 
    • Reducing unplanned downtime to maximize production output. 
    • Extending asset life, delaying capital expenditures. 
    • Improving safety and compliance, avoiding costly penalties. 
    • Enhancing customer trust and market reputation, leading to higher revenues. 

    Let’s explore these financial benefits in detail. 

    1. Lower Maintenance Costs and Increased Efficiency

    A reactive maintenance approach (fixing equipment only after it fails) leads to: 

    • Higher repair costs due to emergency breakdowns. 
    • Increased labor expenses for urgent repairs. 
    • Production losses from unexpected downtime. 

    By contrast, a proactive reliability strategy (preventive and predictive maintenance) ensures: 

    • Early detection of issues, reducing expensive emergency repairs. 
    • Better resource planning, optimizing labor and material costs. 
    • Lower spare parts inventory, as failures are predictable. 

    Studies show that predictive maintenance can reduce maintenance costs by 20-30% while improving asset availability. This directly enhances profitability by lowering operational expenses. 

    1. Minimizing Downtime to Maximize Revenue

    Unplanned downtime is one of the most expensive risks for any company. Every minute of lost production means lost revenue. 

    For example, in manufacturing, an hour of downtime can cost thousands to millions of dollars, depending on the industry. In power generation, oil & gas, or transportation, failures can disrupt entire supply chains. 

    Reliability-centered organizations use: 

    • Condition monitoring (vibration analysis, infrared thermography, oil analysis, etc.) to prevent breakdowns. 
    • Automated alerts and real-time data to schedule maintenance at optimal times. 
    • Standardized reliability metrics (MTBF, MTTR, OEE) to measure and improve uptime. 

    The result? Higher production efficiency and maximized revenue generation. 

    1. Extending Asset Life and Deferring Capital Expenses

    Replacing assets too soon drains capital budgets, while keeping failing equipment increases maintenance costs. A strong reliability program balances both by optimizing asset performance. 

    With effective reliability strategies, organizations: 

    • Extend asset life by reducing wear and tear. 
    • Delay large capital expenditures by maintaining equipment longer. 
    • Make data-driven decisions on when to replace vs. repair. 

    This helps companies allocate capital efficiently, reinvesting savings into business growth. 

    1. Reducing Safety Incidents and Regulatory Costs

    Unreliable equipment increases the risk of: 

    • Workplace injuries leading to compensation claims and legal penalties. 
    • Environmental hazards resulting in fines and reputational damage. 
    • Regulatory non-compliance, impacting licensing and operations. 

    A strong reliability culture minimizes these risks, leading to: 

    • Lower insurance costs due to a safer work environment. 
    • Fewer compliance violations, avoiding costly fines. 
    • Improved employee morale and productivity, reducing turnover costs. 

    Reliability not only protects workers but also reduces financial liabilities. 

    1. Competitive Differentiation and Customer Trust

    Customers and partners prefer reliable companies that deliver consistent quality and service. An organization known for high uptime, dependable products, and on-time delivery gains: 

    • Stronger customer loyalty, leading to repeat business. 
    • Higher market reputation, attracting premium clients. 
    • Improved contract opportunities, as reliability lowers supply chain risks. 

    Companies with poor reliability lose customers to competitors that offer more consistent service. Investing in reliability builds trust and strengthens financial positioning. 

    Conclusion: Reliability is a Financial Strategy 

    Reliability is not just about equipment; it is a financial strategy that drives profitability, cost savings, and competitive advantage. Organizations that prioritize reliability benefit from: 

    • Lower maintenance and repair costs. 
    • Higher operational efficiency and uptime. 
    • Extended asset life, reducing capital spending. 
    • Fewer safety incidents and compliance risks. 
    • Stronger customer trust and market growth. 

    Companies that invest in reliability don’t just save money; they make money by improving performance, efficiency, and sustainability. Reliability isn’t optional. It’s a key driver of long-term financial success. 

  • The Necessity of Business Acumen in Maintenance

    The Necessity of Business Acumen in Maintenance

    Maintenance professionals have long been regarded as the unsung heroes of organizational operations, ensuring machines run smoothly and assets remain productive. Yet, in today’s competitive business environment, the role of maintenance has expanded beyond just fixing what’s broken. To truly drive organizational success, maintenance leaders and teams must possess a strong sense of business acumen. This blend of operational expertise and strategic understanding allows them to align their efforts with overarching business goals, transforming maintenance from a cost center into a value-creating powerhouse. 

    The Role of Business Acumen in Maintenance 

    • Connecting Maintenance to Business Objectives
      Maintenance is no longer just about keeping equipment operational; it’s about ensuring that the organization’s strategic goals—such as profitability, efficiency, and sustainability—are achieved. Leaders with business acumen understand how their department’s activities influence key performance indicators like Overall Equipment Effectiveness (OEE), Return on Assets (ROA), and EBITDA. This awareness enables them to prioritize tasks and allocate resources to areas that have the greatest impact on the bottom line. 
    • Budgeting and Financial Savvy
      Maintenance teams often manage significant budgets for labor, spare parts, tools, and equipment upgrades. Business acumen helps leaders make informed financial decisions, such as evaluating the return on investment (ROI) of predictive maintenance technologies or determining the cost-benefit ratio of repairing versus replacing aging assets. With a solid grasp of financial principles, maintenance leaders can advocate for their needs in budget discussions, demonstrating how their plans contribute to long-term profitability. 
    • Risk Management and Cost Avoidance
      Unplanned downtime can cost organizations thousands, if not millions, in lost productivity, scrapped materials, and missed deadlines. Maintenance professionals with business acumen don’t just react to equipment failures—they proactively manage risks by implementing strategies like reliability-centered maintenance (RCM) and predictive maintenance. By reducing the frequency and severity of failures, they safeguard the organization’s financial stability and reputation. 
    • Collaboration Across Departments
      Maintenance doesn’t operate in a vacuum; it intersects with production, supply chain, finance, and other functions. Business acumen fosters better collaboration by enabling maintenance professionals to speak the language of other departments. For example, they can work with production teams to schedule downtime in ways that minimize disruption or partner with procurement to secure cost-effective spare parts without compromising quality. 

    Building Business Acumen in Maintenance 

    • Understanding Financial Metrics
      Maintenance professionals should familiarize themselves with metrics like cost per unit produced, asset utilization, and operating margins. This knowledge allows them to see how their work directly impacts the organization’s financial health. 
    • Learning to Prioritize
      Not all maintenance activities have the same impact on the bottom line. Leaders with business acumen prioritize tasks that reduce downtime, improve efficiency, and extend asset life, focusing their efforts where they matter most. 
    • Communicating Value
      To gain support from executives, maintenance leaders must effectively communicate how their initiatives align with business goals. This might involve presenting data-driven insights on cost savings, productivity gains, or risk reduction achieved through maintenance programs. 

    Realizing the Potential 

    A maintenance team armed with business acumen doesn’t just fix machines; they drive organizational success. They identify opportunities for efficiency, champion innovation, and position maintenance as a strategic asset. In a world where businesses must continuously improve to stay competitive, the necessity of business acumen in maintenance is no longer optional—it’s a critical component of success. 

    By fostering this mindset, organizations empower their maintenance teams to move beyond the mechanical and into the strategic, ensuring their work contributes to both operational excellence and financial performance 

  • Mastering Maintenance Leadership: The Blueprint for Strategic Business Planning

    Mastering Maintenance Leadership: The Blueprint for Strategic Business Planning

    In the realm of maintenance leadership, strategic business planning isn’t an option; it’s a prerequisite for success. The dynamic interplay of technology, industry standards, and organizational needs demands a clear roadmap for navigating the complex landscape of maintenance and reliability. Here, we delve into the significance of maintenance leadership in business planning and how it paves the way for optimal asset management and operational excellence.

    The Fusion of Leadership and Strategy

    Maintenance leadership transcends the role of maintaining equipment and preventing breakdowns. It requires a strategic vision that aligns with the organization’s overarching goals. Successful maintenance leaders operate as change agents, driving innovation and fostering a culture of continuous improvement.

    Components of Maintenance Leadership Business Planning

    1. Asset Management Strategy: At the core of business planning, maintenance leaders design asset management strategies that encompass the entire lifecycle of equipment. This includes acquisition, operation, maintenance, and disposal. Strategic asset management reduces costs, extends equipment life, and maximizes ROI.
    2. Maintenance Strategies: Leaders establish maintenance strategies that balance preventive, predictive, and corrective maintenance. They determine the most efficient way to keep assets operational and perform cost-benefit analyses to make informed decisions.
    3. Reliability Engineering: Reliability engineering focuses on designing and implementing systems and processes that maximize asset reliability. Maintenance leaders integrate reliability engineering principles into their business plans to optimize asset performance.
    4. Safety Protocols: Ensuring the safety of personnel is paramount. Maintenance leaders develop and incorporate safety protocols into business plans to protect employees and assets, reducing incidents and related costs.
    5. Data-Driven Decisions: Maintenance leaders leverage data analytics to make informed decisions. They collect data from various sources, including sensors and condition monitoring systems, to predict failures and optimize maintenance schedules.

    The Impact of Maintenance Leadership on Business

    Effective maintenance leadership has a far-reaching impact on business operations:

    1. Improved Asset Reliability: Strategic business planning ensures that assets are reliable and consistently meet performance standards. This minimizes downtime and maximizes productivity.
    2. Cost Reduction: By preventing breakdowns and optimizing maintenance schedules, maintenance leaders reduce operational and maintenance costs. Efficient resource allocation and inventory management contribute to cost savings.
    3. Enhanced Product Quality: Reliable equipment translates to consistent product quality. Quality assurance is integral to business planning and maintenance leadership.
    4. Energy Efficiency: Maintenance leaders focus on optimizing asset performance, which often leads to energy savings and reduced environmental impact.
    5. Compliance and Safety: Strategic business planning includes compliance with safety standards and regulations. Maintenance leaders promote a safe work environment and minimize risks.

    Incorporating Technology

    Maintenance leadership business planning relies heavily on technology, including:

    1. Condition Monitoring Systems: These systems continuously assess the health of equipment, enabling predictive maintenance and early fault detection.
    2. Computerized Maintenance Management Systems (CMMS): CMMS streamlines maintenance workflows, asset tracking, and reporting, facilitating efficient planning.
    3. IoT and Industry 4.0: The integration of IoT and Industry 4.0 concepts provides real-time data and insights for predictive maintenance.
    4. Data Analytics: Advanced analytics help maintenance leaders derive actionable insights from vast amounts of data.

    The Way Forward: Continuous Improvement

    Maintenance leadership business planning is not static; it evolves to adapt to changing needs and technologies. It encompasses a culture of continuous improvement, where leaders and teams collaborate to refine processes and enhance performance continually.

    In conclusion, maintenance leadership and strategic business planning are inseparable partners in the pursuit of operational excellence. Effective planning and leadership drive reliability, safety, and cost-efficiency, positioning an organization for long-term success. With a strategic mindset, a commitment to innovation, and the embrace of technology, maintenance leaders chart the course to a future where assets remain robust, operations remain efficient, and quality remains uncompromised.


  • Elevating Excellence: Unveiling the Art of Maintenance, Repairs, and Operations Process Development

    Elevating Excellence: Unveiling the Art of Maintenance, Repairs, and Operations Process Development

    In the intricate web of industrial operations, maintenance, repairs, and operations (MRO) process development stands as the unsung hero, optimizing workflows, minimizing downtime, and ensuring the seamless continuity of production. It’s a craft that requires precision, strategic planning, and a knack for efficiency. Let’s embark on a journey to uncover the art of MRO process development and why it’s the lynchpin of high-quality operations.

    The Artistry of MRO Process Development

    MRO process development is the science of creating a structured, efficient system to manage the maintenance, repairs, and operations of assets. It goes far beyond reactive fixes; it’s about proactive measures that enhance the reliability and longevity of equipment.

    Key Elements of MRO Process Development

    1. Asset Management: MRO process development begins with a comprehensive inventory of all assets. It involves meticulous cataloging, maintenance history tracking, and categorization based on criticality.
    2. Maintenance Strategy: Development of a well-defined maintenance strategy is crucial. This includes preventive and predictive maintenance schedules, maintenance plans, and a prioritization system.
    3. Spare Parts Inventory: Efficient MRO process development includes managing spare parts inventories, ensuring the right parts are available at the right time to minimize equipment downtime.
    4. Data-Driven Decisions: Advanced data analytics and condition monitoring play a pivotal role. Real-time data informs decision-making, allowing for predictive maintenance and reducing unexpected failures.
    5. Safety and Compliance: Safety is paramount. MRO process development incorporates safety protocols and ensures that equipment complies with industry standards and regulations.
    6. Supplier Relationships: It involves building and nurturing relationships with suppliers to ensure a reliable supply chain for spare parts and materials.
    7. Workflow Optimization: MRO process development streamlines workflows, reduces unnecessary steps, and eliminates bottlenecks to improve operational efficiency.

    The Impact on Operations

    Exemplary MRO process development has a profound impact on operations:

    1. Reduced Downtime: By ensuring equipment is well-maintained, MRO process development minimizes unplanned downtime, leading to increased productivity and operational continuity.
    2. Cost Efficiency: Well-developed MRO processes optimize resource allocation, reduce maintenance and repair costs, and extend asset life, contributing to significant cost savings.
    3. Enhanced Safety: Safety protocols integrated into MRO processes create a safer work environment, reducing accidents and protecting both personnel and assets.
    4. Energy Savings: Optimized equipment performs more efficiently, leading to energy savings and reduced environmental impact.
    5. Quality Assurance: High-quality equipment translates to consistent product quality, improving customer satisfaction.

    Integration of Technology

    MRO process development isn’t confined to the realm of manual labor; technology plays a pivotal role:

    1. Computerized Maintenance Management Systems (CMMS): These systems streamline work order management, asset tracking, and preventive maintenance scheduling, making processes more efficient.
    2. Condition Monitoring Systems: Real-time monitoring systems detect changes in equipment condition, enabling predictive maintenance. This allows for earlier parts ordering.
    1. IoT and Industry 4.0: Integration of IoT and Industry 4.0 concepts provides real-time data and insights for predictive maintenance. This also allows for earlier parts ordering.
    1. Data Analytics: Advanced analytics help in deriving actionable insights from data, making processes more informed and efficient.

    Continuous Improvement and Innovation

    MRO process development is not static; it’s a journey of continuous improvement. Teams work together to refine processes, adapt to technological advancements, and embrace innovative solutions. It’s a culture of learning and evolution.

    In conclusion, MRO process development is a strategic craft that ensures the harmony of industrial operations. It’s the heart of efficiency, cost savings, and operational excellence. It’s where precision meets productivity, where proactive measures outweigh reactive fixes, and where assets perform at their best. The artistry of MRO process development is an ode to the future, where operations remain seamless, costs remain contained, and quality remains uncompromised.

  • Selling Maintenance as a Profit Center

    Selling Maintenance as a Profit Center

    The best way to change perspectives is to show the entire organization how maintenance provides value.

    By Joe Anderson | Oct 13, 2015

    Throughout my years in manufacturing maintenance, I have faced situations in which my peers and managers above me have had no understanding of the value of maintenance. For a long time, I blamed them. As I have matured in my management journey, I have come to understand that it is my job to educate everyone, not just those for whom I am responsible, about maintenance’s true worth.

    Example 1: Cost avoidance related to a vacuum pump failure
    When a vacuum pump failure occurred on a production line, the total cost associated with that failure was $9,523:

    • 1 vacuum pump = $2,700
    • 3 hours of downtime = $2,250
    • 1 hole in the wall repaired = $500
    • Emergency weekend work = $4,073 (four support techs were scheduled, multiplied by two shifts to run new wire and fix conduit. This 64 hours of work multiplied by $57 per hour = $3,648 in labor + $425 in materials)

    By contrast, early detection of a similar vacuum pump failure incurred a total cost of two hours of downtime, which is equal to $1,500. (The pump from the manufacturer was faulty, so we will receive a replacement free of charge.)
    This is a cost avoidance of $8,023.

    The  awareness gap results from management having limited or no knowledge of the maintenance function and its ability to contribute to the manufacturing process; and maintenance personnel, managers included, having limited understanding of the business side of manufacturing. The result is that management and maintenance often are often unsure how they together contribute to the company’s success.

    Your company’s maintenance attitude

    When I ask managers or hourly workers what their organization’s perception of maintenance is, I tend to get the same types of responses. I hear things like:

    • Maintenance is a cost center
    • Maintenance is a necessary evil
    • Maintenance is the cost of doing business
    • Maintenance personnel are firefighters

    When asked to define maintenance, they offer words such as fix, restore, replace, recondition, patch and rebuild. I’d say these are reactive definitions of the word. What is maintenance? Maintenance is to maintain or the act of maintaining. The basis for maintaining is to keep something in a specific state or condition – that is, to keep it (the asset, in our case) in an existing state or preserve it from failure or decline. There is a world of difference between this definition and the words and functions normally recalled by most people who are “knowledgeable” about the maintenance function. The best way to change the perspective is to show the entire organization how it is that maintenance provides value. To keep things simple here, let’s focus on three types of value: convenience, process improvement, and financial value.

    • Convenience is sold through a demonstrated or statistical approach to prove that a plant will be safer and will produce higher-quality product, resulting in less rework. Greater production efficiency means lower costs; lower costs gives us marketing advantage; marketing advantage and enhanced competitiveness can promote job security. You empower people to do what they know to do by providing the proper tools and removing obstacles to their getting it done.
    • Process improvement is sold through less downtime. This means running to plan, which makes the production manager look like a superhero. Better asset use improves capacity, which means more volume, more profit, and more recognition. Also, less downtime results in less frustration, raising morale and helping to drive culture change.
    • Financial value is sold through the freeing of cash flow, reduced costs, and higher profits. These all translate into two things: higher stock value and more capital for reinvestment into the company.

    Manage in three directions

    There are three directions in which a manager has to manage: up, out, and down. Managing up, out, and down means sharing your vision for your department and educating everyone you can on what true, proactive maintenance is. I have to educate the upper management, my peers, and those I am entrusted to manage. It is your responsibility as well (no matter your title).  As a maintenance manager, I have not just a responsibility but an obligation to educate those around me on the maintenance function and the ways that we add value. So, let’s look at the three ways. Let’s start with managing those we are entrusted to manage. Although all three of these areas are intertwined and affect everyone, the best way to sell this group is through convenience. Going home to their family with all limbs intact, not having to endure a day of hard labor, and striving to be the best are great ways to motivate this group. Convincing this group takes execution of low hanging fruit for quick wins. The goal is to gain their trust and buy-in into your system with the expectation of becoming world class. You have to empower your employees to manage programs such as condition monitoring, MRO, planning and scheduling, etc., with you by their side as a coach. Also, one of my goals is always to set the standard for the organization in whatever we do. If you can do this, you will not have someone else determining how you are going to execute your maintenance strategy. The easiest way to get your vision squashed is to have another maintenance manager within your organization determining what your best practices should be, especially when they are contradictory to proactivity in maintenance. At the peer level, the key is to try to develop a partnership. With that, you show value by showing them what can be if they buy-in to your system and partner with you in driving process improvement. What any production manager wants is process stability with reduced variation. One example would be defect elimination. Offer to train their employees and them as well as to how to drive defects out of the system. Show them statistics and case studies as proof that the system works.

    Example 2: Raise profit margins through efficiency gains for “product XYZ”
    The total financial picture is a complicated one, but bear with me in this example for the sake of simplicity.We need to produce 800 cases of product XYZ, and run eight-hour shifts. Optimized, we can produce 10 cases an hour, but because of system defects causing minor stops and breakdowns, we run only five cases an hour. We have scheduled to run this product over the next two weeks. At the current run rate it will take us a month to run this product. It takes five employees who make $10/hour to run this line. To hit commitment, we are going to have to run 12-hour shifts and weekends. The product and material cost for 800 cases is $8,000.

    • There are five cartons in one case.
    • Material cost per case is $10.
    • Cost per carton is $2.

    At current run rate, labor cost without employee benefits is $11,200

    • 80 hours straight time x 5 employees x $10/hour = $4,000
    • 64 hours overtime x 5 employees x $15/hour = $4,800
    • 24 hours double time x 5 employees x $20/hour = $2,400

    Labor + material total cost is $19,200. Total cost per case is $24, and cost per carton is $4.80.  We then sell the case at $25, making our profit $1 per case. By contrast, if we eliminate the defects from the line by restoring equipment and create procedures to make sure we do not go backward, we can run at operator design rate, which is 10 cases per hour. Total cost of material and labor for ODR is $12,000.

    • Our material costs stay the same: $8,000.
    • If we run only on straight time to hit our commitment, our cost incurred from labor is $4,000.

    Total cost per case is now $15, and cost per carton is now $3. Our profit is now $10 per case vs. the $1 per case at the previous rate. If you extend that scenario over a full year, 20,800 cases a year produced on the line in each scenario, it looks like this:

    • Current run-rate profit = $20,800/yr
    • New (restored) run-rate profit = $208,000/yr

    I do not know any manager who wouldn’t want these results. I truly believe that the problem is that there is a huge knowledge gap about what kind of return on investment maintenance can provide.

    A word of caution: Make sure you have the knowledge level to launch a system like this that will be sustainable. If not, seek help from outside resources. All of us have already been through 46 different flavor-of-the-month operations systems. What they do not need is another one.  Understand the gaps that separate you from where you want to be. Also, don’t be a finger-pointer, be a solutions provider. The first two directions to manage are fairly simple to understand and do. Managing up is normally where the wheels fall off. What happens in most organizations, because the maintenance manager does not understand this piece of the equation, is that they do not get their way with an initiative they want to roll out or a project they think will help them win over their department. They then become frustrated and use the management’s lack of understanding as an excuse as to why they will never succeed in their current situation. What needs to be understood is that the upper management, 90% of the time, doesn’t understand what maintenance does or what they should or shouldn’t do. These managers know only that maintenance is a cost center. They normally think that maintenance is needed to keep things running, not make them a profit. This is where we can work to change that mentality. Value to the upper management is sold in dollars. If you can convert everything that you want to do to dollars, you will have a higher success rate at selling your ideas to the organization. Will they say yes every time? No. Your job is to make it a difficult “no.” We all seem to know that maintenance is a key part of any organization, but we really struggle when we have to explain to the upper management just how important maintenance is. Trying to translate a maintenance vision into financial benefits is a difficult thing to do, yet we have to if we want to be able to make the right decisions and do the right things to turn it around. An area that most maintenance mangers seem to struggle with is the business side of their job. It is vital that we begin to understand the financial side in order to sell the organization on your maintenance vision. The biggest key to learning the financial side is that focus needs to be put on the fact that maintenance is a profit center, not a cost center. What needs to be understood, then, is that value, when sold to an organization’s upper management from the maintenance perspective, needs to be defined in terms of dollars. That means every project, plan, or initiative that you want to launch needs to be converted to dollars. Whether it is a raise in your OEE, raise in your wrench time, or prevention of failures, it needs to be captured and converted to dollars. So let me say it one more time: You have to convert everything you do into dollars. You have to toot your own horn to begin the change of perspective of maintenance being a cost center to being a profit center. What you will find out is that you are probably already doing things that can be captured; you just need to understand how to capture and convert. It is all about perspective. When people hear of all these good things that are going on within your department, people begin to believe.

    Business basics

    If we really want to gain credibility with upper management (and, to be honest, everyone with whom you come in contact), you have to convert your maintenance initiatives into business language and dollars. For example, you can say that you need a $20,000 investment to start job kitting because job kitting will improve your wrench time. The question is why upper managers would care about job kitting. Do they even know what wrench time is? Put your request in the right terms. Quantify that an initial investment of $20,000 to establish a job-kitting system will improve your wrench time by X% by eliminating wasted time spent trying to find parts and procedures. Explain that this reduction in waste is expected to lower labor spending by Y amount within Z years. Note that it will also raise productivity because the department will be able to do more with less, likely resulting in a gain in line efficiencies as well. The estimated plant-wide throughput increase thanks to this one initiative will be A%, leading to a profit gain of $B. So, by the end of year Z, your return on investment will be $C or $D. It is very important that you do this as much as possible with everything that you do but, you first have to learn some basics about business. Competitive Advantages give a company an edge over its rivals and an ability to generate greater value for the firm and its shareholders. The more sustainable the competitive advantage, the more difficult it is for competitors to neutralize the advantage. There are two main types of competitive advantages: comparative advantage and differential advantage. Comparative advantage, or cost advantage, is a firm’s ability to produce a good or service at a lower cost than its competitors, which gives the firm the ability to sell its goods or services at a lower price than its competition, or to generate a larger margin on sales. A differential advantage is created when a firm’s products or services differ from its competitors and are seen as better than a competitor’s products by customers. Understanding your competitive advantage will help you understand your area of focus. If it is a comparative advantage, you will be more cost driven. If it is differential, you will want your equipment to run more efficiently because demand for your unique product will be high. In most industries, the best way to gain market share and increase volume, it is to drive down costs. Driving down costs through reliability efforts will make your organization the most competitive in the market place.

    Cash flow

    A company’s cash flow is the difference between all the cash that goes out (buying raw materials, utilities, labor, overheads, investment, dividends, interest, and loan payments) and the money that comes in (receipts from customers). If the cash flow is negative, that is, the cash in is less than the cash out, the company will need to borrow more money or it will be unable to buy supplies, labor, utilities, etc. In short, if there is no cash, there is no business. Under normal economic cycles, businesses will experience a series of upswings and downswings. During the upswing, a business can put on “fat” and then, during the downswing, it is difficult to lose that fat because they are used to operating in a manner consistent with the good times. This fat becomes a burden that exaggerates the effect of the downswing. The secret to long-term profit maximization is to set up your business with a minimum of fat at all times. This maximizes the profits during a rising market and, when inevitably the market turns, minimizes your harm as business falls. Where the rubber meets the road Your goal is to do your part to make sure your organization’s cash flow is positive, meaning that the amount of cash in is greater than the cash out. This is a profit gain. Profits do two things: they raise stock value and free up funds for more capital investments. What can we do to make a positive impact on our cash flow, and turn the thinking around that maintenance is a cost center to a belief that maintenance is a profit center?

    1. Work safely. Incidents don’t just hurt people; they hurt business as well. The National Safety Council reported in 2012 that the average comprehensive cost by injury severity was:

    • Death: $4,538,000
    • Incapacitating injury: $230,000
    • Non-incapacitating evident injury: $58,700
    • Possible injury: $28,000
    • No injury: $2,500

    2. Produce high-quality product without mistakes.
    3. Produce the lowest-cost product as possible.
    4. Reduce storeroom stock and costs incurred because of stockouts.
    5. Use condition-based monitoring technologies to cut utility and failure costs.
    6. Increase wrench time through planning/scheduling work, eliminating waste and allowing you to accomplish more work in the same amount of time.

    Cost savings vs. cost avoidance

    Many people do not understand the difference between cost savings and cost avoidance. Cost savings occur when there is a reduction that causes future spending to fall below the level of current spending, whereas cost avoidance refers to reductions that cause future spending to fall but not below the level of current spending. Consider these scenarios for a better view: Scenario 1 – Your MRO buyer finds the same part from another vendor at a reduced price, resulting in a savings of $100,000 per year. This scenario reflects cost savings. These cost savings may then be removed from budgets, reinvested, or redirected to other spending priorities, such as  process improvements, driving profitability. Scenario 2 – The buyer also resists a vendor’s attempt to raise prices by 5%, allowing the storeroom to avoid spending an additional $200,000 that year. This second scenario is an example of cost avoidance. Often, cost avoidance involves slowing the rate of cost increases. In other words, future spending would have increased even more in the absence of cost-avoidance measures. Also, and of most importance, prevention of failure will be a cost avoidance. Your mission: Convert all of these savings to dollars and email the information to relevant parties in your plant to help you change the perception of the maintenance department from cost center to profit center.

    Opportunity costs

    Opportunity cost refers to the cost of an alternative that is forgone to pursue another action. Let’s say the decision is made to run a fan to failure. This decision costs the plant $10,000 in lost production. The cost to do vibration analysis would have been $30 a month. This would have given you the opportunity to plan and schedule work on the fan on a down day, avoiding the lost-production cost. The opportunity cost is $9,970. KPIs. Which key performance indicators should you track for your political campaign? I measure four things:

    • Dollars of maintenance spend to percent of RAV
    • Dollars of inventory stock to percent of RAV
    • Maintenance cost per unit
    • Year-over-year utility spend.

    Are these the only KPIs out there? No. These are what I track. Choose to use whichever you see fit. All I am trying to measure is our effectiveness toward profit gain.

    Starting your political campaign

    Announce that you’re starting your campaign, and capture as many cost savings and avoidances as you can. Share your findings with the world. You can even get creative with it. Create a newsletter and share your “Find of the Week,” for example. Here are some other possibilities:
    Savings-avoidance log
    Cost savings is a bit easier to capture than cost avoidance. I give my buyer and planner/scheduler a spreadsheet as shown in Table 1, with a few columns delineating, for example, vendor 1, vendor 2, part description, old cost, new cost, cost savings or cost avoidance, etc. An updated spreadsheet gets turned in to me on a monthly basis, and I share the savings with the leadership group. (In-house vs. third-party rebuilds contribute to cost savings as well.)

    Selling maintenance table

    Cost avoidances are a bit different. When you talk vendors out of price hikes, that’s easy to capture. Make sure your buyer captures these on the spreadsheet, too. The hard thing to capture is failure prevention. Find out your replacement asset values, your maintenance cost per unit produced, the total cost of downtime with overhead figured in (remember, total cost of downtime per line). Illustrate what a 1% improvement in overall equipment effectiveness (OEE) is worth in profit. Also, find out how long failures normally last. If you use your CMMS/EAM system properly, you should have this information. If you do not, good luck –you will have to do it all manually. As you begin to sell to members of your organization, remember that return on investment will be key for them. Be sure to capture all you can to show that they are getting this. Brag about your department and learn from your mistakes. Strive to be the best at all you do. In so doing, you’ll put yourself in the best position to win the political campaign of selling maintenance as a profit center.

  • Understanding Plant Losses

    Understanding Plant Losses

    The Way Losses are Calculated
    and OEE/TEEP Calculation

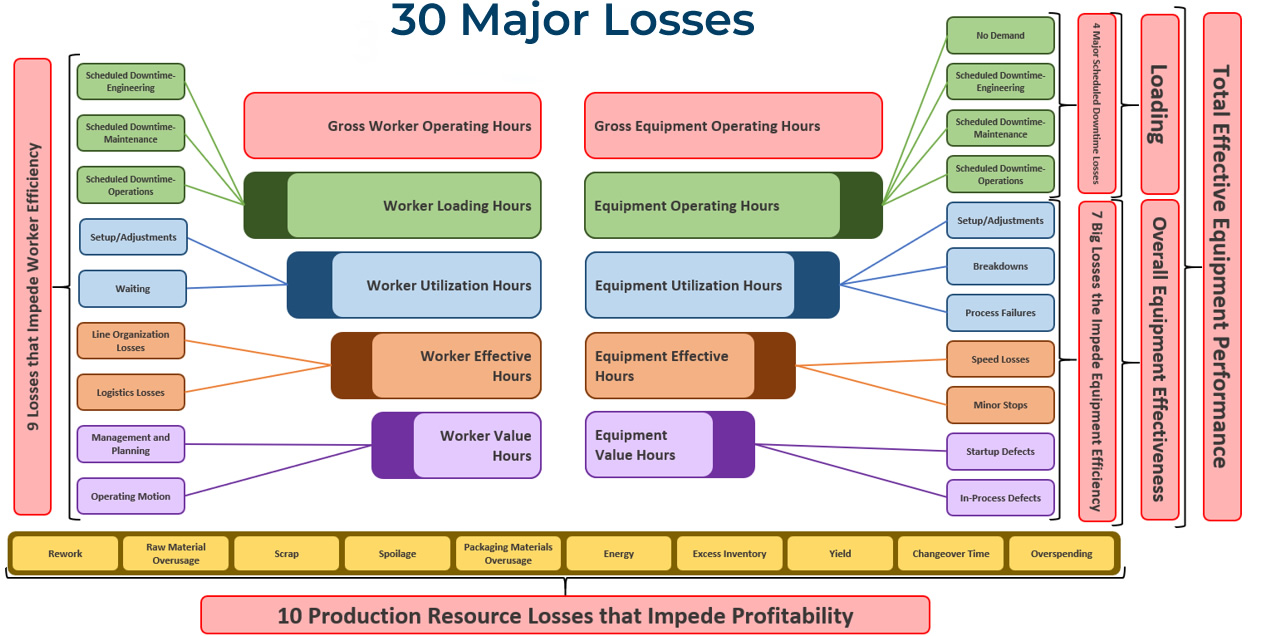
    In order to get a broad, clear picture of where to focus, you have to view your whole plant as a large system of fully manageable processes. No matter your role, your job is to improve plant processes, helping to produce the highest quality product, at the lowest price possible, in the safest manner. In order to see this big picture, you have to be honest and expose true problems within your facility. From that perspective, you will be able to recognize the different types of losses in your plant and how to secure significant gains in productivity by controlling those losses.

    How to determine where to focus

    The examples in this article use weekly numbers, but the same analysis can and should also be applied monthly, quarterly, and annually. Here we will look at how we apply metrics to some of the different loss types. Armed with an understanding of how your plant is losing productivity and how to measure those losses, you can effectively increase profitability. Let’s look at a few areas of loss.

    Available Time To Produce (Loading)
    1. First, you figure all scheduled downtime. Remember your buckets and put time scheduled in each of the buckets: Changeovers, Engineering Planned Shutdown, Maintenance Planned Shutdown, Operations Planned Shutdown, or No Customer Orders.
    2. Add them all together to come up with your Scheduled Downtime.
    3. Then subtract that from total hours in a week (168 hours available).

    Example: (Planned Maintenance of 24 hours) + (Changeovers of 4 hours) = 28 hours of scheduled downtime.
    (168 hours in a week) – (28 hours Scheduled Downtime) = 140 hours available to produce.

    Loading Calculation: (140 scheduled production hours) / (168 hours in a week) = 83%

    This gives you your Available Time To Produce, 140 hours per week or 83%.

    Quality Rate

    Start by taking your startup rejects and your in-process rejects, add them together, then subtract that value from your total units produced.

    Example: (35 Startup Rejects) + (35 In-Process Rejects) = 70 Rejects.
                   7,070 Total Units Produced.
    7,070 70 = 7,000 Good Units Produced.

    Quality Rate Calculation: (Good Units Produced) / (Total Units Produced) or 7,000 / 7,070 = 99%

    Net Good Processing Hours

    Find your Net Good Processing Hours by dividing your Average Weekly Throughput by your Weekly Design Rate.

    Example: Average Weekly Rate is 7,000 units produced.
    Weekly Design Rate is 100 units per hour.
    7,000 / 100 = 70 Net Good Processing Hours.

    Then, divide your Net Good Processing Hours by your Available Time To Produce.

    Example:  Available Time To Produce is 140 hours weekly.
    70 Net Good Processing Hours / 140 Available Hours To Produce = 50%

    Net Good Processing Hours Calculation: (Average Weekly Rate) / (Weekly Design Rate)
    That is, (Weekly Units Produced) / (Weekly Design Units per Hour)

    Availability

    Begin by taking your Average Breakdown Downtime, Process Failure Downtime and Set/Adjustment Downtime, adding them together, then subtracting the total from the Available Time To Produce.

    Example: (13 hours of Breakdowns) + (1 hour of Process Failures) + (1 hour of Setup/Adjustment) = 15 hours downtime
    (140 hours Available Time To Produce) (15 hours Downtime) = 125 hours Availability per week

    Availability Calculation: (125 hours Availability) / (140 hours Available Time To Produce) = 89% Availability

    Performance

    First, take your Actual Weekly Run Rate and subtract it from the Weekly Design Rate.

    Example: (Weekly Design Rate of 100 per hour) (Actual Weekly Run Rate of 85 per hour) = 15 units per hour lost.

    To convert that loss to hours, divide the Actual Weekly Run Rate by the Weekly Design Rate, subtract that quotient from 100, then multiply that difference by the Availability (in hours per week).

    Example: ( 100 (Actual Weekly Run Rate) / (Weekly Design Rate) ) x (Weekly Availability)
    ( 100 (85 units/hr / 100 units/hr) ) x (125 hours available to produce) = 19 hours in speed losses

    Now, subtract the hours in Speed Losses from the Weekly Availability hours to get Available Time To Produce.

    Example: (125 hours Weekly Availability) (19 hours in Speed Losses) = 106 hours Available Time To Produce.

    To find minor stops, subtract your Net Good Processing Hours from your Available Time To Produce.

    Example: (106 hours Available Time To Produce) (70 hours Net Good Processing Hours) = 36 hours of minor stops per week.

    Performance Calculation: (Speed Losses + Minor Stops) / Weekly Availability
    (19 hours in Speed Losses + 36 hours in Minor Stops) / (125 hours Weekly Availabilty)
    (19 + 36) / 125 = 56% Performance

    OEE/TEEP Calculations: OEE = Availability * Performance * Quality
    OEE = 89% * 56% * 99% = 49%
    TEEP = Loading * OEE     (Loading = Percentage Available Time To Produce)
    TEEP = 83% * 49% = 41%

    7 Big Losses: Minor Stops: 36 hours per week
    Speed Losses: 19 hours per week
    Breakdowns: 14 hours per week
    Process Failures: 1 hour per week
    Setup/Adjustment Losses: 1 hour per week
    Quality Startup Losses: 0.5 hour per week
    Quality In-Process Losses: 0.5 hour per week

    If these were your numbers, where would you focus?