
Category: Competitive Advantage

  • The Financial Competitive Advantage of Reliability

    The Financial Competitive Advantage of Reliability

    The Financial Competitive Advantage of Reliability 

    Reliability is more than just a technical goal; it is a strategic financial advantage. Organizations that prioritize reliable assets, equipment, and operations outperform competitors by reducing costs, improving efficiency, and maximizing return on investment (ROI). 

    Reliability-driven companies experience lower maintenance costs, higher production efficiency, and increased profitability. When reliability is built into operations, businesses gain a sustainable financial edge that allows them to reinvest in growth and innovation. 

    How Reliability Creates Financial Competitive Advantage 

    Reliability impacts an organization’s financial performance in multiple ways, including: 

    • Lowering maintenance costs through proactive strategies. 
    • Reducing unplanned downtime to maximize production output. 
    • Extending asset life, delaying capital expenditures. 
    • Improving safety and compliance, avoiding costly penalties. 
    • Enhancing customer trust and market reputation, leading to higher revenues. 

    Let’s explore these financial benefits in detail. 

    1. Lower Maintenance Costs and Increased Efficiency

    A reactive maintenance approach (fixing equipment only after it fails) leads to: 

    • Higher repair costs due to emergency breakdowns. 
    • Increased labor expenses for urgent repairs. 
    • Production losses from unexpected downtime. 

    By contrast, a proactive reliability strategy (preventive and predictive maintenance) ensures: 

    • Early detection of issues, reducing expensive emergency repairs. 
    • Better resource planning, optimizing labor and material costs. 
    • Lower spare parts inventory, as failures are predictable. 

    Studies show that predictive maintenance can reduce maintenance costs by 20-30% while improving asset availability. This directly enhances profitability by lowering operational expenses. 

    1. Minimizing Downtime to Maximize Revenue

    Unplanned downtime is one of the most expensive risks for any company. Every minute of lost production means lost revenue. 

    For example, in manufacturing, an hour of downtime can cost thousands to millions of dollars, depending on the industry. In power generation, oil & gas, or transportation, failures can disrupt entire supply chains. 

    Reliability-centered organizations use: 

    • Condition monitoring (vibration analysis, infrared thermography, oil analysis, etc.) to prevent breakdowns. 
    • Automated alerts and real-time data to schedule maintenance at optimal times. 
    • Standardized reliability metrics (MTBF, MTTR, OEE) to measure and improve uptime. 

    The result? Higher production efficiency and maximized revenue generation. 

    1. Extending Asset Life and Deferring Capital Expenses

    Replacing assets too soon drains capital budgets, while keeping failing equipment increases maintenance costs. A strong reliability program balances both by optimizing asset performance. 

    With effective reliability strategies, organizations: 

    • Extend asset life by reducing wear and tear. 
    • Delay large capital expenditures by maintaining equipment longer. 
    • Make data-driven decisions on when to replace vs. repair. 

    This helps companies allocate capital efficiently, reinvesting savings into business growth. 

    1. Reducing Safety Incidents and Regulatory Costs

    Unreliable equipment increases the risk of: 

    • Workplace injuries leading to compensation claims and legal penalties. 
    • Environmental hazards resulting in fines and reputational damage. 
    • Regulatory non-compliance, impacting licensing and operations. 

    A strong reliability culture minimizes these risks, leading to: 

    • Lower insurance costs due to a safer work environment. 
    • Fewer compliance violations, avoiding costly fines. 
    • Improved employee morale and productivity, reducing turnover costs. 

    Reliability not only protects workers but also reduces financial liabilities. 

    1. Competitive Differentiation and Customer Trust

    Customers and partners prefer reliable companies that deliver consistent quality and service. An organization known for high uptime, dependable products, and on-time delivery gains: 

    • Stronger customer loyalty, leading to repeat business. 
    • Higher market reputation, attracting premium clients. 
    • Improved contract opportunities, as reliability lowers supply chain risks. 

    Companies with poor reliability lose customers to competitors that offer more consistent service. Investing in reliability builds trust and strengthens financial positioning. 

    Conclusion: Reliability is a Financial Strategy 

    Reliability is not just about equipment; it is a financial strategy that drives profitability, cost savings, and competitive advantage. Organizations that prioritize reliability benefit from: 

    • Lower maintenance and repair costs. 
    • Higher operational efficiency and uptime. 
    • Extended asset life, reducing capital spending. 
    • Fewer safety incidents and compliance risks. 
    • Stronger customer trust and market growth. 

    Companies that invest in reliability don’t just save money; they make money by improving performance, efficiency, and sustainability. Reliability isn’t optional. It’s a key driver of long-term financial success. 
  • Understanding Plant Losses

    Understanding Plant Losses

    The Way Losses are Calculated
    and OEE/TEEP Calculation

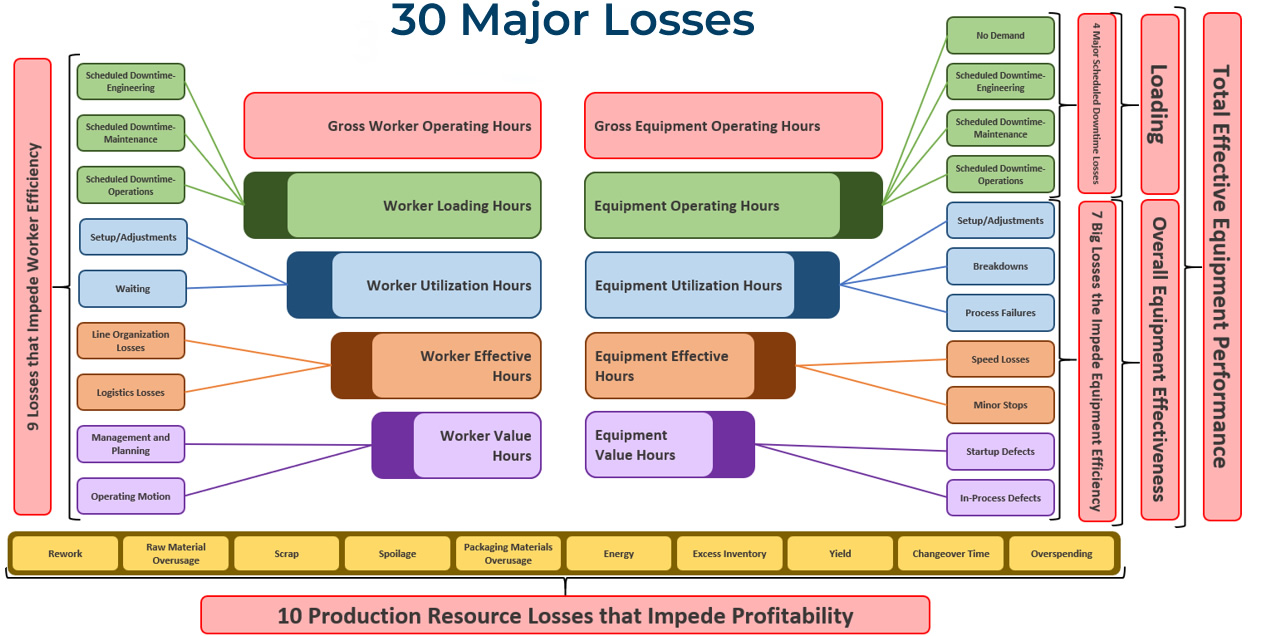
    In order to get a broad, clear picture of where to focus, you have to view your whole plant as a large system of fully manageable processes. No matter your role, your job is to improve plant processes, helping to produce the highest quality product, at the lowest price possible, in the safest manner. In order to see this big picture, you have to be honest and expose true problems within your facility. From that perspective, you will be able to recognize the different types of losses in your plant and how to secure significant gains in productivity by controlling those losses.

    How to determine where to focus

    The examples in this article use weekly numbers, but the same analysis can and should also be applied monthly, quarterly, and annually. Here we will look at how we apply metrics to some of the different loss types. Armed with an understanding of how your plant is losing productivity and how to measure those losses, you can effectively increase profitability. Let’s look at a few areas of loss.

    Available Time To Produce (Loading)
    1. First, you figure all scheduled downtime. Remember your buckets and put time scheduled in each of the buckets: Changeovers, Engineering Planned Shutdown, Maintenance Planned Shutdown, Operations Planned Shutdown, or No Customer Orders.
    2. Add them all together to come up with your Scheduled Downtime.
    3. Then subtract that from total hours in a week (168 hours available).

    Example: (Planned Maintenance of 24 hours) + (Changeovers of 4 hours) = 28 hours of scheduled downtime.
    (168 hours in a week) – (28 hours Scheduled Downtime) = 140 hours available to produce.

    Loading Calculation: (140 scheduled production hours) / (168 hours in a week) = 83%

    This gives you your Available Time To Produce, 140 hours per week or 83%.

    Quality Rate

    Start by taking your startup rejects and your in-process rejects, add them together, then subtract that value from your total units produced.

    Example: (35 Startup Rejects) + (35 In-Process Rejects) = 70 Rejects.
                   7,070 Total Units Produced.
    7,070 70 = 7,000 Good Units Produced.

    Quality Rate Calculation: (Good Units Produced) / (Total Units Produced) or 7,000 / 7,070 = 99%

    Net Good Processing Hours

    Find your Net Good Processing Hours by dividing your Average Weekly Throughput by your Weekly Design Rate.

    Example: Average Weekly Rate is 7,000 units produced.
    Weekly Design Rate is 100 units per hour.
    7,000 / 100 = 70 Net Good Processing Hours.

    Then, divide your Net Good Processing Hours by your Available Time To Produce.

    Example:  Available Time To Produce is 140 hours weekly.
    70 Net Good Processing Hours / 140 Available Hours To Produce = 50%

    Net Good Processing Hours Calculation: (Average Weekly Rate) / (Weekly Design Rate)
    That is, (Weekly Units Produced) / (Weekly Design Units per Hour)

    Availability

    Begin by taking your Average Breakdown Downtime, Process Failure Downtime and Set/Adjustment Downtime, adding them together, then subtracting the total from the Available Time To Produce.

    Example: (13 hours of Breakdowns) + (1 hour of Process Failures) + (1 hour of Setup/Adjustment) = 15 hours downtime
    (140 hours Available Time To Produce) (15 hours Downtime) = 125 hours Availability per week

    Availability Calculation: (125 hours Availability) / (140 hours Available Time To Produce) = 89% Availability

    Performance

    First, take your Actual Weekly Run Rate and subtract it from the Weekly Design Rate.

    Example: (Weekly Design Rate of 100 per hour) (Actual Weekly Run Rate of 85 per hour) = 15 units per hour lost.

    To convert that loss to hours, divide the Actual Weekly Run Rate by the Weekly Design Rate, subtract that quotient from 100, then multiply that difference by the Availability (in hours per week).

    Example: ( 100 (Actual Weekly Run Rate) / (Weekly Design Rate) ) x (Weekly Availability)
    ( 100 (85 units/hr / 100 units/hr) ) x (125 hours available to produce) = 19 hours in speed losses

    Now, subtract the hours in Speed Losses from the Weekly Availability hours to get Available Time To Produce.

    Example: (125 hours Weekly Availability) (19 hours in Speed Losses) = 106 hours Available Time To Produce.

    To find minor stops, subtract your Net Good Processing Hours from your Available Time To Produce.

    Example: (106 hours Available Time To Produce) (70 hours Net Good Processing Hours) = 36 hours of minor stops per week.

    Performance Calculation: (Speed Losses + Minor Stops) / Weekly Availability
    (19 hours in Speed Losses + 36 hours in Minor Stops) / (125 hours Weekly Availabilty)
    (19 + 36) / 125 = 56% Performance

    OEE/TEEP Calculations: OEE = Availability * Performance * Quality
    OEE = 89% * 56% * 99% = 49%
    TEEP = Loading * OEE     (Loading = Percentage Available Time To Produce)
    TEEP = 83% * 49% = 41%

    7 Big Losses: Minor Stops: 36 hours per week
    Speed Losses: 19 hours per week
    Breakdowns: 14 hours per week
    Process Failures: 1 hour per week
    Setup/Adjustment Losses: 1 hour per week
    Quality Startup Losses: 0.5 hour per week
    Quality In-Process Losses: 0.5 hour per week

    If these were your numbers, where would you focus?