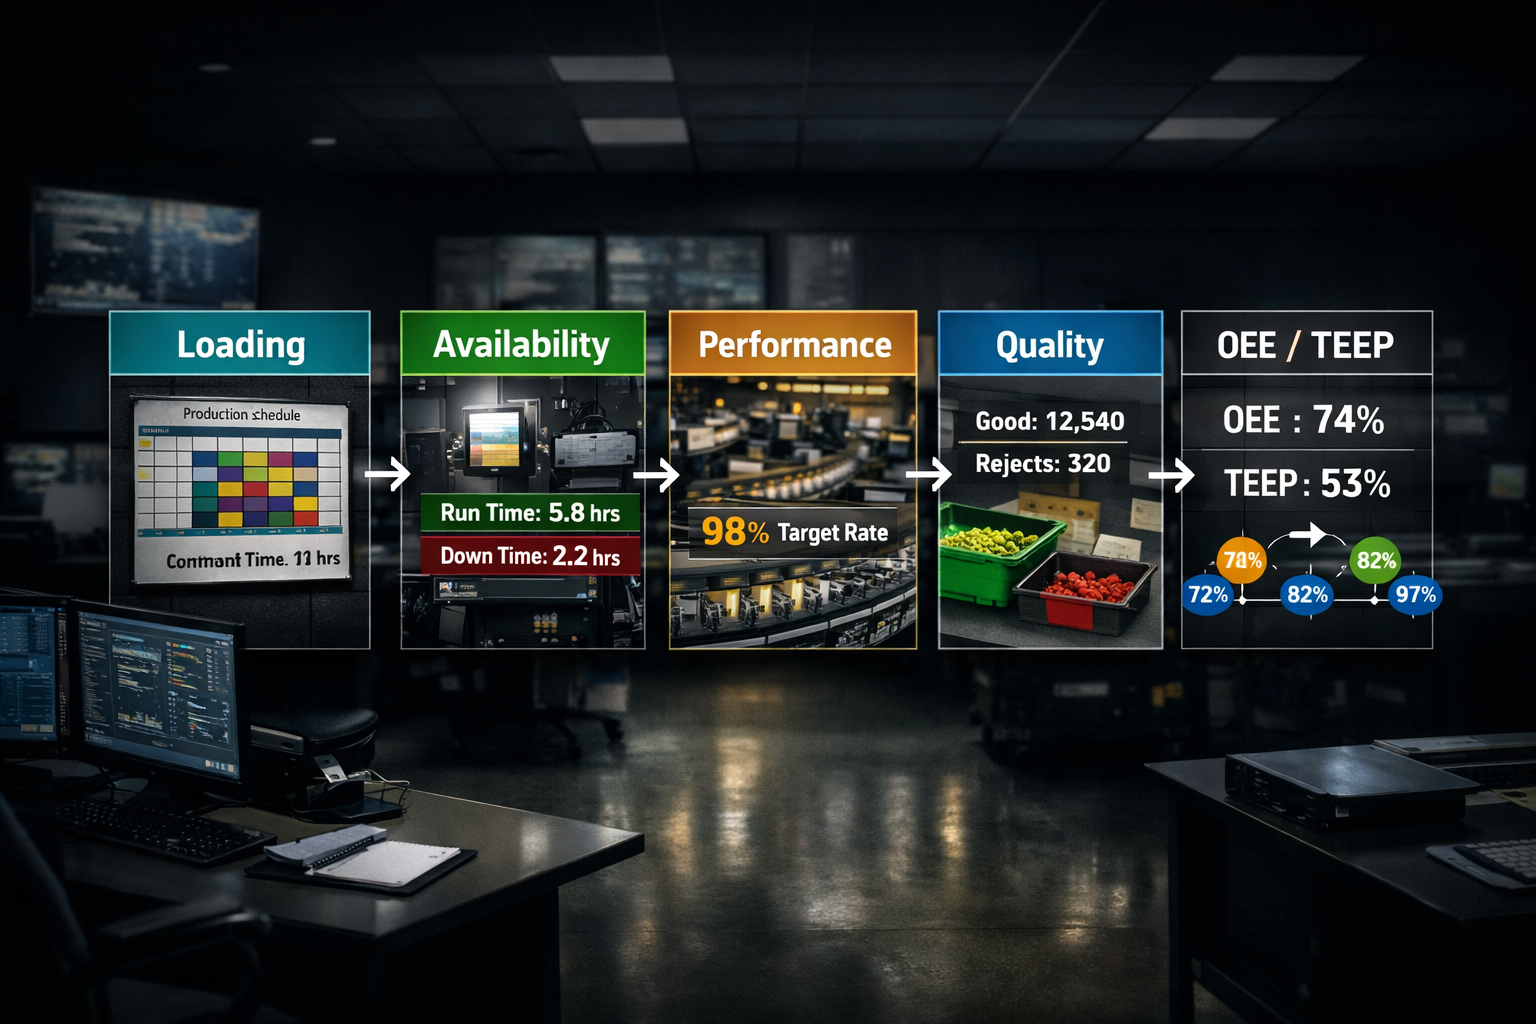
Business Acumen: Calculating OEE and TEEP to Improve Operations
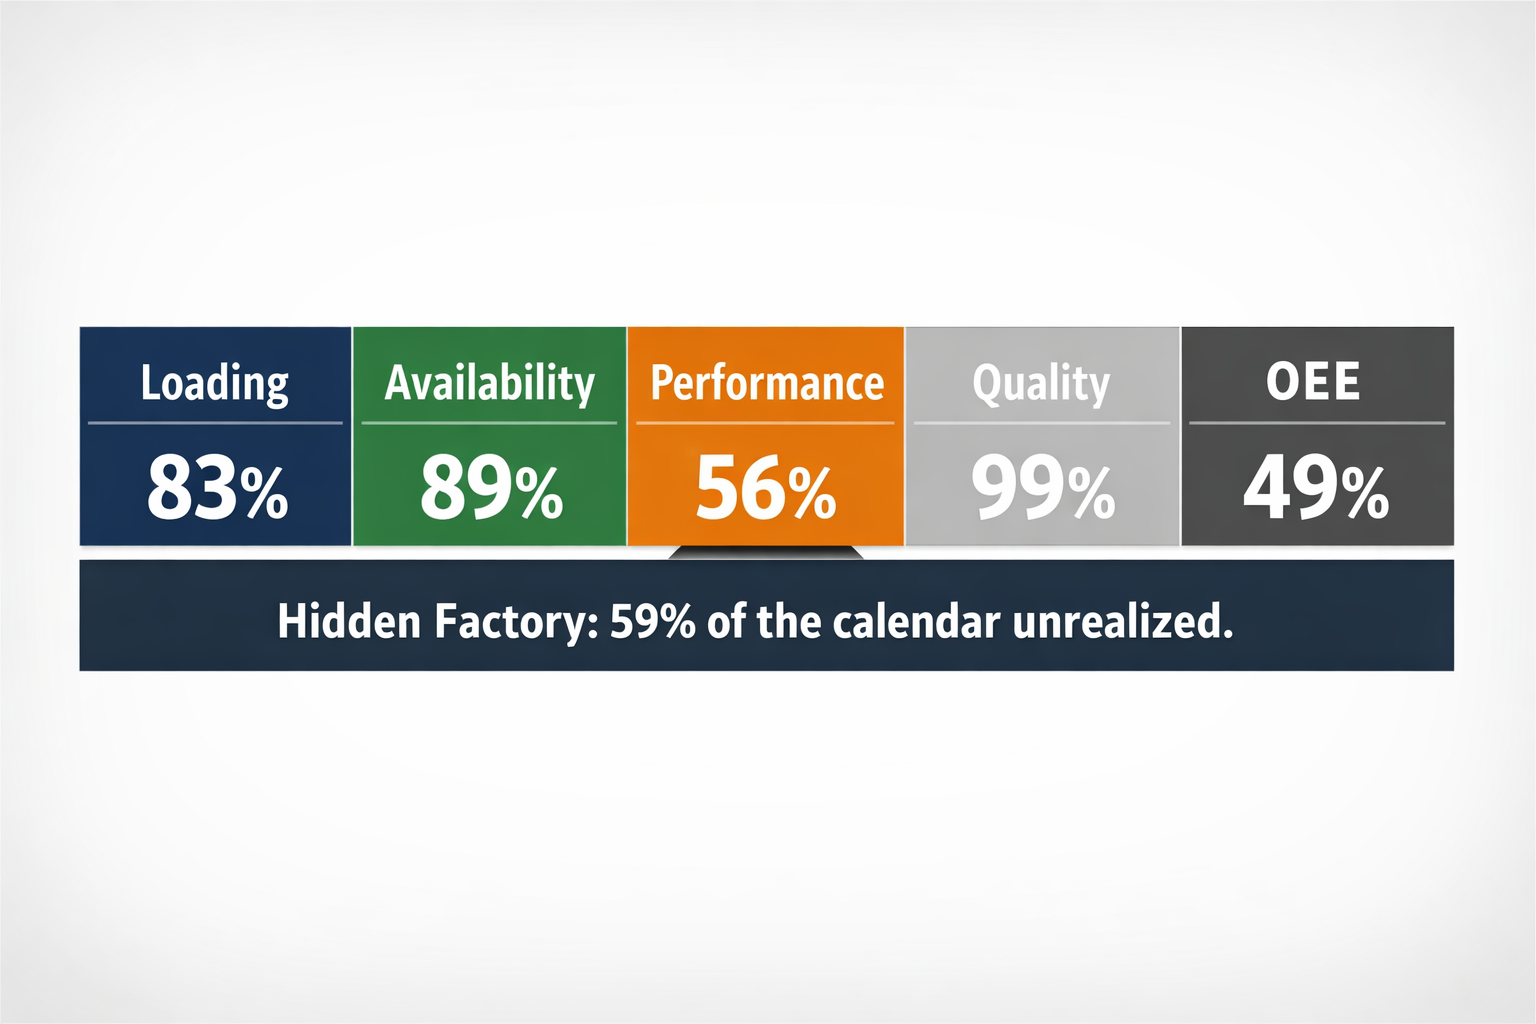
One line, one week, every step. Use this as the template for your own line.
In the last post we laid out the five numbers and their formulas. Now we run them, start to finish, on a single line for a single week. Follow along with a calculator if you like. By the end you’ll be able to do this on one sheet of paper for any line in your plant.
The setup
A packaging line, a standard 168-hour week. Here’s everything we know going in.
| Input | Value |
| Total hours in the week | 168 |
| Planned Maintenance | 24 hours |
| Changeovers (planned) | 4 hours |
| Breakdowns (unplanned) | 13 hours |
| Process Failures | 1 hour |
| Setup and Adjustment downtime | 1 hour |
| Total units produced | 7,070 |
| Startup rejects | 35 |
| In-process rejects | 35 |
| Design rate | 100 units/hour |
| Actual run rate when running | 85 units/hour |
Step 1: Loading
Planned downtime is the 24 hours of PM plus the 4 hours of changeovers, so 28 hours. Subtract that from the calendar.
Scheduled Hours = 168 – 28 = 140 hours
Loading = 140 / 168 = 83%
Step 2: Quality
Total rejects are the 35 startup plus 35 in-process, so 70 units. The rest were good.
Good Units = 7,070 – 70 = 7,000
Quality = 7,000 / 7,070 = 99%
Step 3: Availability
Unplanned downtime is breakdowns plus process failures plus setup and adjustment: 13 + 1 + 1 = 15 hours. Subtract that from scheduled time.
Available Hours = 140 – 15 = 125 hours
Availability = 125 / 140 = 89%
So far, so healthy. Now comes the number that breaks the line open.
Step 4: Performance
This one runs in three moves.
First, speed loss. The line is rated for 100 units an hour but actually ran at 85.
Speed Loss % = (100 – 85) / 100 = 15%
Speed Loss Hours = 15% x 125 = 19 hours
Hours remaining after speed loss = 125 – 19 = 106 hours
Second, minor stops. We figure out how many hours it should have taken to make 7,000 good units at full design rate, then compare.
Net Good Processing Hours = 7,000 / 100 = 70 hours
Minor Stop Hours = 106 – 70 = 36 hours
Third, put it together.
Total performance loss = 19 + 36 = 55 hours
Performance = 70 / 125 = 56%
There it is. The line was available 89% of the time, but only performed at 56%. Fifty-five hours of the week evaporated into speed losses and minor stops, and almost none of it was on a downtime sheet.
Step 5: OEE and TEEP
Now the roll-ups.
OEE = Availability x Performance x Quality
OEE = 89% x 56% x 99% = 49%
TEEP = Loading x OEE
TEEP = 83% x 49% = 41%
What these numbers actually tell us
| Metric | Value | What it tells us |
| Loading | 83% | We scheduled most of the calendar. |
| Availability | 89% | Decent uptime when scheduled. |
| Performance | 56% | The problem. Speed and minor stops are eating us alive. |
| Quality | 99% | Excellent. Keep doing what works. |
| OEE | 49% | Below average, and the drag is clearly performance. |
| TEEP | 41% | 59% of the calendar is unrealized. A massive hidden factory. |
Remember the hidden factory from Part 2, the one I said shows up when TEEP sits at 41%? This is that exact line. The math just told us, in one number, that nearly six-tenths of this asset’s potential is sitting unused, and it pointed straight at the culprit: performance, not breakdowns.
Ranking the 7 big losses on this line
| Loss bucket | Hours/week | Priority |
| Minor Stops | 36 | 1 (largest) |
| Speed Losses | 19 | 2 |
| Breakdowns | 13 | 3 |
| Process Failures | 1 | 4 (tied) |
| Setup and Adjustment | 1 | 4 (tied) |
| Quality, Startup | 0.5 | 6 (tied) |
| Quality, In-Process | 0.5 | 6 (tied) |
If these were your numbers, where would you focus? The honest answer is minor stops and speed losses, by a wide margin. The breakdown noise is loud, but the quiet minor stops are costing you nearly three times as much.
Now translate it to dollars
This is the step that moves the conversation upstairs. Assume contribution margin is $50 a unit at a design rate of 100 units an hour. That makes every lost hour worth $5,000.
- Minor stops: 36 hours/week x $5,000 = $180,000/week, about $9.4M a year.
- Speed losses: 19 hours/week x $5,000 = $95,000/week, about $4.9M a year.
- Breakdowns: 13 hours/week x $5,000 = $65,000/week, about $3.4M a year.
On this single line, the top three losses represent over $17M of annual contribution sitting on the table.
Notice what just happened. “Performance is 56%” is a number a plant manager nods at. “We’re leaving $17M a year on this one line” is a number that gets a project funded tomorrow. Same data, different language. That translation is the entire point of Part 3.
Try it yourself
Calculate OEE and TEEP for one of your own lines using last week’s data:
- Pull the planned and unplanned downtime for the week.
- Pull total units produced, startup rejects, and in-process rejects.
- Look up the design rate and the actual run rate.
- Walk through Steps 1 through 5 above on a single sheet of paper.
Then compare against world-class targets: Loading 80% to 90%, Availability 90%, Performance 95%, Quality 99%, OEE 85%, TEEP 75%. Your biggest gap is where you start.
Key takeaways
- OEE = Availability x Performance x Quality. TEEP = Loading x OEE.
- Always calculate all five components, not just the OEE roll-up, or you won’t know where the loss lives.
- A performance score in the 50s is a flashing sign that minor stops and speed losses are hiding in the data.
- Always translate hours of loss into dollars of contribution before you bring the analysis upstairs.
Coming next, Part 3, Post 3: Where to Focus First.
If your numbers look anything like this example, it is time to take a closer look at what is driving your losses. ReliabilityX helps plants uncover the hidden factory behind speed losses, minor stops, and performance drag. Our team works directly with your data to identify where the opportunity lives and how to capture it.