Business Acumen: The Five Numbers Behind OEE and TEEP
OEE and TEEP turn the 30 losses into a single number a CFO can act on.
The Five Numbers Behind OEE and TEEP
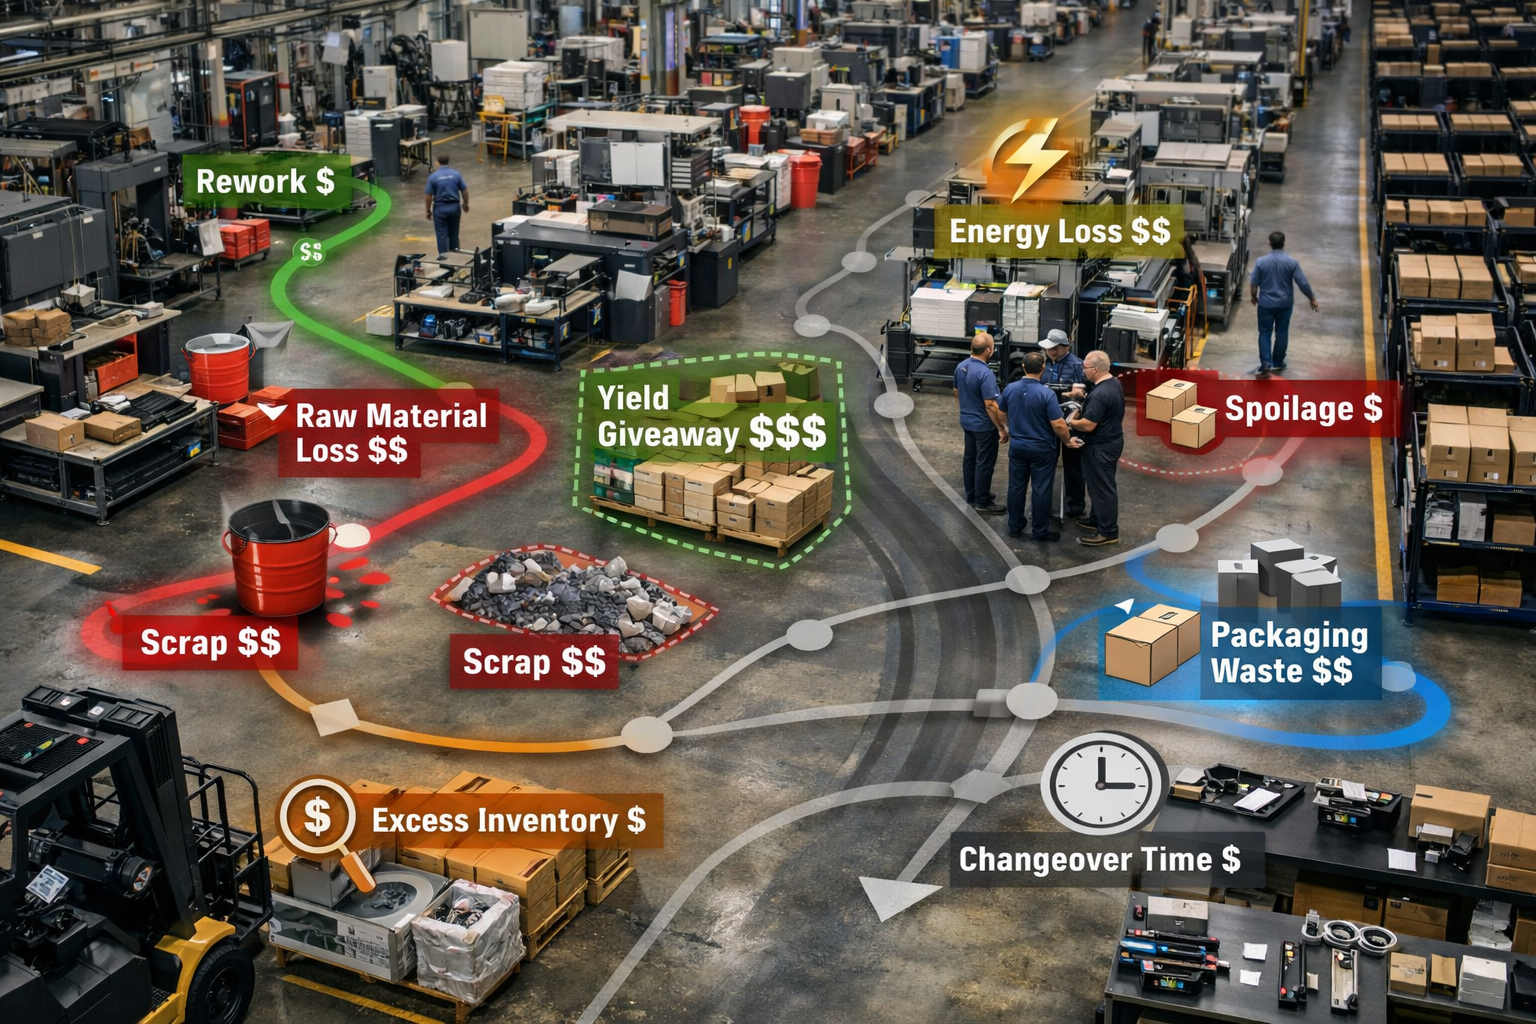
In Part 2 we named all 30 losses. Now we turn them into numbers, because a target you can name but can’t measure still won’t get funded. The good news is that the whole industry has settled on a small chain of calculations that roll the 30 losses up into one score. The trick is understanding the chain before you trust the score.
Why five numbers instead of one
It’s tempting to want a single number for plant performance. Resist it. A single number hides where the problem actually is. If OEE slips from 60% to 55%, that one figure can’t tell you whether you have a downtime problem, a speed problem, or a quality problem. Five linked components can. Each one isolates a different family of loss, so the number doesn’t just tell you that you’re bleeding; it tells you where.
| Component | The question it answers |
| Loading | How much of the available time did we plan to run? |
| Availability | Of the planned time, how much did we actually run? |
| Performance | When we ran, did we run at design speed? |
| Quality | Of what we produced, how much was good? |
| OEE / TEEP | The roll-up scores that combine the above. |
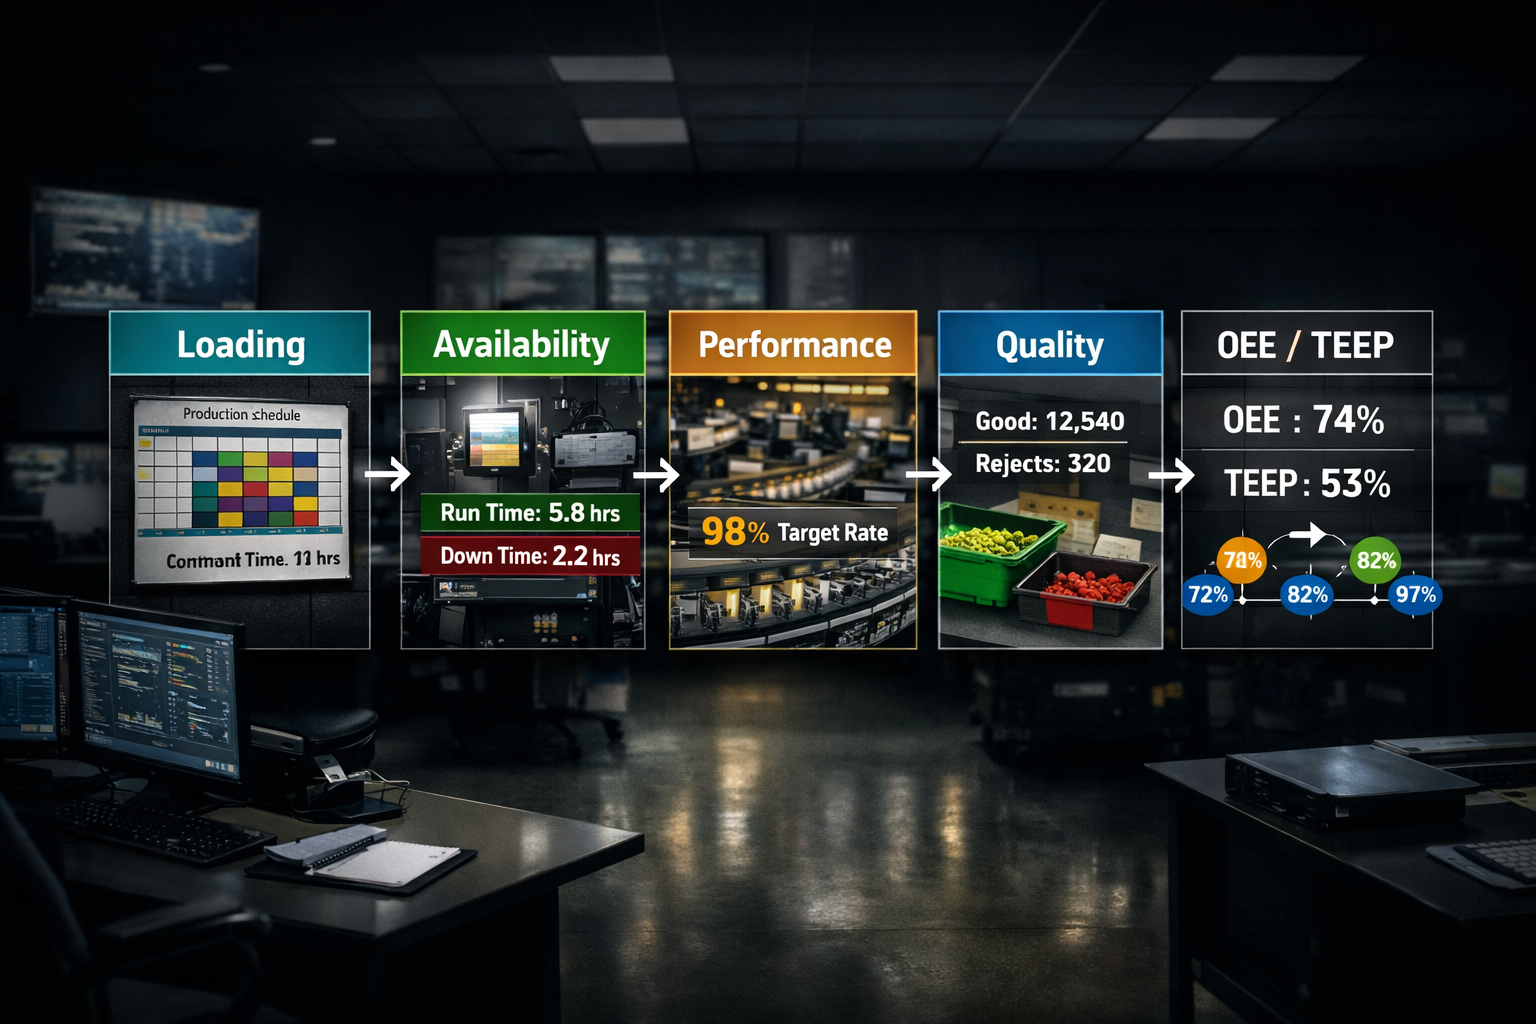
Read top to bottom, that’s the chain: Loading, then Availability, then Performance, then Quality, then the two roll-ups. Let’s take them one at a time.
- Loading
Loading is how much of the calendar you scheduled to run. You start from the full 168 hours in a week and subtract everything you planned not to run: PMs, changeovers, scheduled engineering and operations time, and any hours with no customer demand.
Scheduled Hours = 168 – (Planned Maintenance + Changeovers + Engineering + Operations + No Demand)
Loading = Scheduled Hours / 168
Loading is one of the rare metrics where higher isn’t automatically better. Run too hot and you leave no room for PMs, which pushes you straight into reactive mode. Run too cold and you’re paying for fixed costs you aren’t using. Most plants live somewhere between 70% and 90% loading depending on demand.
- Availability
Availability asks: of the time you planned to run, how much did you actually run? You take your scheduled hours and subtract the unplanned downtime, the breakdowns, process failures, and setup and adjustment time.
Available Hours = Scheduled Hours – (Breakdowns + Process Failures + Setup/Adjustments)
Availability = Available Hours / Scheduled Hours
- Performance
Performance asks: when the line was actually running, did it run at the speed it was designed for? This is where two losses combine, the speed losses (running below design rate) and the minor stops (those sub-10-minute stops that almost never get logged).
Speed Loss % = (Design Rate – Actual Rate) / Design Rate
Speed Loss Hours = Speed Loss % x Available Hours
Net Good Processing Hours = Total Units Produced / Design Rate
Minor Stop Hours = (Available Hours – Speed Loss Hours) – Net Good Processing Hours
Performance = Net Good Processing Hours / Available Hours
Performance is the most slippery of the four, and it’s worth knowing why. Speed losses just look like the line “running a little slow today.” Minor stops are each too small to bother writing down. Put them together and they routinely eat 30% to 40% of available time while never appearing on a single report. That’s exactly the hidden factory from Part 2, showing up in the math.
- Quality
Quality asks: of the units you produced, how many were good the first time? You subtract the startup rejects and the in-process rejects from total production.
Good Units = Total Units Produced – (Startup Rejects + In-Process Rejects)
Quality = Good Units / Total Units Produced
- The two roll-ups: OEE and TEEP
Now the chain comes together into the two numbers leadership cares about.
OEE = Availability x Performance x Quality
TEEP = Loading x OEE
These answer two different questions, and the difference matters. OEE tells you how well you ran during the time you planned to run. TEEP tells you how much of all possible time, 24 hours a day, every day of the year, you actually converted into good product. OEE is the report card for your scheduled hours. TEEP is the report card for your whole asset.
For reference: world-class OEE is around 85%, while most plants live between 40% and 60%. World-class TEEP rarely climbs above 60% even in the best operations, which tells you just how much room is hiding in a typical plant.
Key takeaways
- Five numbers, one chain: Loading, then Availability, then Performance, then Quality, then OEE and TEEP.
- Each number isolates a different category of loss, so the score tells you where to focus, not just that you’re losing.
- Performance, the combination of speed losses and minor stops, is usually the most under-counted of the four.
- OEE and TEEP are not the same. OEE asks how well you ran; TEEP asks how much of the calendar you converted.
Coming next, Part 3, Post 2: Calculating OEE and TEEP, a Full Worked Example.