Tag: Leadership

  • Three Arguments Your Hourly Rate Wins for You 

    Three Arguments Your Hourly Rate Wins for You 

    You now have a number: what one hour on your constraint is worth. Here is how to spend it this week. None of these require a project, a budget, or anyone’s approval. 

    1. Should we take the line down for the planned work? 

    This argument usually runs on instinct and organizational politics. Operations does not want the downtime. Maintenance does not want the failure. Both positions are reasonable and neither is quantified, so the loudest voice wins and the decision gets remade every month. 

    Reprice it. 

    A four hour planned intervention on our packaging line costs $24,000 in contribution margin. That is the cost of saying yes. 

    Now the other side. Pull the history on the failure mode you are trying to prevent. If the unplanned version has historically run eight hours, it costs $48,000 each time it occurs. If it has occurred twice in the last twelve months, the expected annual exposure is $96,000. 

    The comparison is now arithmetic, and it can be documented, revisited, and defended. Sometimes the answer will be to defer, and that is fine. A deferral you can justify is worth more than a shutdown you cannot. 

    2. Is the spare part worth stocking? 

    Inventory arguments are among the longest running and least resolvable disputes in most plants, because the two sides are measuring different things. Materials management is measuring carrying cost and working capital. Maintenance is measuring the wait. 

    Price the wait. 

    A critical part with a six hour lead time on a constraint asset is protecting $36,000 every time the failure occurs. A $9,000 part with a two year expected life, against a failure mode that occurs annually, is not an inventory decision at that point. It is obviously correct, and it takes one line to show. 

    The reverse also applies, and you should be willing to run it. Plenty of parts sitting in stores protect assets with protective capacity, where the wait costs nothing. Pricing the hour cuts both ways, which is exactly what makes it credible when you use it in your favor. 

    3. Was the overtime worth it? 

    Every plant approves recovery overtime and almost none of them measure the return. 

    An overtime shift that genuinely recovers five constraint hours returns $30,000 against a few thousand dollars of premium labor. That is a decision worth repeating and worth telling your plant manager about. 

    An overtime shift spent on an asset that was never the constraint returns nothing, regardless of how much work got done. That is also worth knowing, and the honest version of this analysis is what makes people trust the favorable version later. 

    Run last month’s overtime through the rate. Whatever the answer is, you will have learned something your plant did not previously know. 

    The pattern 

    All three of these are decisions your plant is already making, repeatedly, using judgment. None of them are bad decisions. They are simply unpriced, and unpriced decisions drift toward whoever argues most persistently rather than toward whatever is worth the most. 

    You are not adding a process. You are adding a number to a conversation that was already happening. 

    This week 

    Take one real decision from your own plant this month and reprice it with your rate. Write down the before and the after. 

    Bring that repriced decision into next week, because next week we stop estimating and start counting, and you will want an example of what the rate is for.  

  • Scheduled Time or Calendar Time, and Which One to Defend 

    Scheduled Time or Calendar Time, and Which One to Defend 

    Once you have sized your hidden plant, the first challenge you get will be about the denominator. It is a fair challenge and you should have the answer ready, because the two available answers are both correct and they serve different audiences. 

    Against scheduled time 

    This measures the hours you staffed, powered, and paid for. Weekends you did not run, shifts you did not staff, and planned shutdowns are excluded. 

    It is the plant manager’s number. It is fair to the crew, because it only counts time the plant asked the asset to produce. It is defensible on the floor, because nobody can argue that you are charging them for hours the business chose not to schedule. And it is the right basis for the case you are going to build, because the action you will propose operates inside scheduled time. 

    On our packaging line, that number is $10.5mm a year. 

    Against calendar time 

    This measures the asset you actually bought, all 8,760 hours of it. 

    It is the capital committee’s number. It answers a different question: how much of the equipment on the balance sheet is producing margin, and how much capacity is available without buying new steel. It is the number a private equity buyer runs during diligence, and it is the number that competes directly with a capital request for additional capacity. 

    It is always larger, sometimes dramatically so, and it is uncomfortable in a way that is occasionally productive. 

    Why the choice matters more than the arithmetic 

    Use the wrong one in the wrong room and you lose the room. 

    Put the calendar time figure in front of a crew that has been working hard and you have told them, in effect, that their best week was a fraction of what it should have been. It reads as an accusation regardless of your intent, and the honest counting you are about to ask them for will not happen. 

    Put the scheduled time figure in front of a capital committee that is weighing a new line and you have understated your own case, because the committee is deciding about the asset, not about the shift schedule. 

    The rule is simple. Build the case on scheduled time. Keep the calendar time number in your pocket for the capital conversation, and produce it only when someone proposes buying capacity you may already own. 

    The reflex this is aimed at 

    When demand rises, the reflex is a capital request. New line, new packer, new building. The business case is straightforward, the approval path is well worn, and the request moves quickly because everyone involved knows how to evaluate it. 

    Meanwhile the hidden plant sits inside assets already on the balance sheet. It requires no capital approval, no installation window, no ramp up curve, and no additional floor space. And it produces nothing, because nobody has sized it and therefore nobody has proposed it. 

    The question worth putting in front of leadership is not whether to add capacity. It is whether to collect the capacity already purchased before purchasing more. That question has never been asked in most plants, and it is not asked because the number required to ask it does not exist. 

    The objection you will get 

    “We cannot sell everything we make.” 

    This is the right challenge and it deserves a real answer, which is that recovered hours can be taken three ways. As volume, where they convert to margin at full value. As cost, by running fewer scheduled shifts for the same output and removing premium labor and utility hours from the base. Or as capacity held, where the hidden plant becomes a capital avoidance argument and the next line gets deferred by years. 

    The mistake is treating an unsellable hour as a free one. It is not free. It was paid for. 

    This week 

    Calculate both numbers. Present one. Know which room you are in. 

  • Your Plan Is Not Your Capacity 

    Your Plan Is Not Your Capacity 

    There is a plant somewhere this month that will beat plan by three percent, hold a short celebration, and leave $10mm of contribution margin on the floor. Nobody involved will do anything wrong. 

    The mechanism is the plan itself. 

    How the plan absorbs the losses 

    Production plans get built from history, because history is the most defensible input available to a planner. Last year’s actual output becomes this year’s baseline, adjusted for demand, mix, and known changes. Nobody would design it differently, and as a scheduling instrument it works. 

    The problem is what history contains. Last year’s actuals already include last year’s unplanned stops, last year’s slow running, last year’s long changeovers, and last year’s rework. All of it is priced into the baseline as if it were a property of the asset rather than a set of losses that could be recovered. 

    So the losses get inherited, and then they get hidden, because once they are inside the plan they stop being losses and start being the plan. 

    Beat it and you are performing. Miss it and you are underperforming. In neither case does anyone ask the question that finds the money: what was the asset capable of? 

    The two plants 

    It is easier to hold if you think of it as two plants operating in the same building. 

    The visible plant is what you shipped. It is measured, reported, budgeted, forecast, and rewarded. Everything about it is well governed, and it is the plant your P&L describes. 

    The hidden plant is the output you already have every resource to produce and are not producing. Fully staffed, fully powered, fully supplied, fully paid for, and not collected. It has no reporting, no owner, and no line in the budget. 

    The hidden margin is the money trapped in the second plant. It is contribution margin that the fixed cost base has already been paid to produce. 

    That last point is what makes this an executive conversation rather than a maintenance one. You are not proposing to spend money to create capacity. You are proposing to collect capacity you have already bought. 

    What it looks like in numbers 

    Back to the packaging line. Case packer constraint, 600 bags per hour design rate, 417 scheduled hours in the month, $10 contribution margin per bag. 

    Design output at scheduled time: 250,000 bags. 

    Actual good output: 162,500 bags. 

    Hidden plant: 87,500 bags per month. 

    At $10 per bag, that is $875,000 a month, or $10.5mm a year, on one asset. 

    Last week the same asset produced a $1.5mm figure when measured against plan. The plan was concealing a factor of seven. 

    Note what this figure is measured against. Scheduled time only. It excludes weekends and unstaffed shifts entirely, which is what makes it fair to the crew and defensible on the floor. 

    The word that matters is hidden 

    Not lost. Not wasted. Not broken. 

    Hidden means already owned and not collected, and that is a fundamentally different conversation to have with a CFO. Lost capacity sounds like an accusation. Uncollected capacity sounds like an asset, which is exactly what it is, sitting on a balance sheet you are already depreciating. 

    This week 

    Take your asset. Find its design rate, confirm it against the best sustained rate you have documented evidence for, and use the lower figure. Count scheduled hours for one representative month. Multiply. Subtract actual good output. Multiply the gap by contribution margin. 

    Then resist the urge to soften the answer. 

  • Size Your Hidden Plant in Twenty Minutes 

    Size Your Hidden Plant in Twenty Minutes 

    This is the whole calculation. It takes longer to schedule the meeting about it than to do it. 

    The four inputs 

    1. Design rate. Units per hour the asset was built to produce. Start with the nameplate or the original equipment documentation. 

    2. Scheduled hours. Hours in a representative month that the plant asked this asset to produce. Exclude unstaffed shifts and planned shutdowns. 

    3. Actual good output. Units in that same month that were saleable. Good output, not gross output. Anything reworked or scrapped consumed a constraint hour you cannot resell. 

    4. Contribution margin per unit. Price less variable cost, sourced from finance in writing. 

    The arithmetic 

    Design rate times scheduled hours gives design output. 

    Design output less actual good output gives the hidden plant in units. 

    Hidden plant units times contribution margin gives your hidden margin. 

    For our packaging line: 600 bags per hour times 417 hours is 250,000 bags. Less 162,500 actual gives 87,500 bags. At $10 per bag, $875,000 a month, $10.5mm a year, one asset. 

    When the design rate is a problem 

    This is where most people stall, so here is how to handle each case. 

    The nameplate is missing. Ask the original equipment manufacturer, who will usually have it against the serial number. Failing that, use the best sustained rate the asset has actually demonstrated, documented from a production log rather than from memory. 

    The nameplate is obviously inflated. Common, particularly where the asset was specified for a different product or package format than it now runs. Use the best sustained demonstrated rate instead and note the substitution in your assumptions. 

    Nobody agrees on it. Ask two people who have run the asset at its best what it does on a good day. Take the lower figure. You are not trying to win an argument about the ceiling. You are trying to establish a number that survives challenge, and the conservative version does that better. 

    The principle throughout: a defensible number you can hold beats an ambitious number you have to retreat from. Every point you concede on the design rate makes the remaining figure harder to dismiss. 

    Write down your assumptions as you go 

    Four lines is enough. 

    Design rate, and where it came from. Scheduled hours, and what you excluded. Actual good output, and whether it is good or gross. Contribution margin, and who at finance provided it. 

    Those four lines are what turn your figure from an opinion into a calculation. The first person who challenges the number will challenge one of them, and having the answer ready is what ends the challenge rather than starting a debate. 

    Expect it to feel too big 

    It will. Nearly everyone’s first reaction to their own hidden plant figure is that it must be wrong, because a number that size would surely have been noticed. 

    It has not been noticed because nothing in the reporting system was built to notice it. The P&L cannot see uncollected capacity. The plan has already absorbed the losses. OEE, where it is tracked at all, is frequently reported as a percentage without ever being converted into money. 

    Do not shrink the number to make it comfortable. Test it, which is exactly what the next two weeks are for. If your counted losses land within about ten percent of your calculated gap, the number was right. 

    Your twenty minutes 

    Run the four inputs. Write the four assumption lines. Put the result in one sentence: this asset gives away X dollars of contribution margin per year at current performance. 

    Then carry that sentence into next week, where we start finding out where the hours actually went.

  • Your P&L Cannot See a Lost Hour 

    Your P&L Cannot See a Lost Hour 

    There is a reason smart executives look at complete, accurate financial statements every month and still cannot find the largest margin opportunity in the building. The statements are not wrong. They are answering a different question. 

    What happens to an hour that never ran 

    By the time production reaches the P&L, output has been converted into cost of goods sold, absorbed overhead, and variance. Every one of those figures describes what was produced. 

    The hours that were not produced have no representation. There is no line called capacity not collected. There is no variance account for the four hundred bags the case packer could have run during the shift it spent waiting on a changeover that took longer than it should have. 

    The only trace those hours leave is indirect. Fixed cost spread across fewer units raises absorbed cost per unit, which shows up next quarter as unit cost creep. In the review meeting, that gets discussed as inflation, supplier pricing, or product mix. It is occasionally all three. It is also, quite often, hours. 

    Why the plan makes it worse 

    The plan is the second layer of concealment, and it is well intentioned. 

    Plans are built from history, because history is the most defensible input available. Last year’s actuals become this year’s baseline, adjusted for demand and known changes. That is a reasonable way to run a scheduling function. 

    It is a terrible way to measure capacity. Every loss embedded in last year’s performance gets inherited into this year’s plan and then hidden by it. Beat the plan and the plant is congratulated. Nobody asks what the asset was capable of, because the plan has quietly become the answer to that question. 

    So you end up with a plant that looks efficient against a target that was set by its own historical losses. 

    The question that finds the money 

    Stop asking whether the plant hit plan. Ask this instead: 

    How many units did this asset have every resource to produce, and how many did it produce? 

    Every word in that sentence is doing work. Every resource means staffed, powered, supplied, and scheduled. It excludes the shifts you did not staff. It is a fair question, answerable from data you already own, and it produces a number the P&L will never give you. 

    On the packaging line we have been using, the answer is uncomfortable. At 600 bags per hour design rate across 417 scheduled hours in the month, the asset had every resource to produce 250,000 bags. It produced 162,500. 

    The gap to plan was 12,500 bags and $125,000. The gap to what the asset could actually do is 87,500 bags and $875,000 for the month. Same asset, same month, same data, and a number roughly seven times larger. 

    Two ledgers, one plant 

    It helps to think of it as two sets of books that never reconcile. 

    The financial ledger records what you shipped and what it cost. It is audited, governed, and correct. It is also complete only with respect to transactions that occurred. 

    The capacity ledger records what the assets could have delivered and did not. Nobody keeps it. It is not audited because it is not written down. And it holds the larger of the two numbers in most manufacturing plants. 

    You do not need to replace the first ledger. You need to start keeping the second one, on one asset, for one month. 

    What to do this week 

    Take the asset you picked on Monday. Find its design rate from the nameplate or the original equipment documentation, then confirm it against the best sustained rate anyone remembers running. Use the lower of the two, because a conservative number you can defend beats an ambitious one you cannot. 

    Multiply design rate by scheduled hours. Subtract actual good output. Multiply by contribution margin. 

    Expect the result to feel too large. Do not shrink it to feel comfortable. Test it instead. 

  • The Number Your Plant Missed Last Month, and Nobody Could Price It 

    The Number Your Plant Missed Last Month, and Nobody Could Price It 

    Last month your plant made money. It also missed the plan. Both of those things are on the same report, and if you walked into the morning meeting and asked what the miss was worth in contribution margin, you would most likely get silence, followed by three explanations, none of which carries a dollar sign. 

    That silence is worth about $1.5mm a year on a single asset. Here is how that number gets built. 

    The three explanations that never survive a follow up question 

    “We had a rough month.” This describes the result, not the cause. It cannot be sized, compared against last quarter, or attached to an action. It is a summary of the thing you were trying to explain. 

    “The equipment is old.” Age is not a loss category. Two identical assets, purchased the same year, installed on the same site, routinely run twenty points apart. If age were the cause, that would not happen. 

    “We are short people.” Sometimes true and usually incomplete. It rarely explains why the same crew delivered plan the month before with the same headcount. 

    None of these are dishonest. They are what capable people say when nobody has given them a counting system. The failure here is structural, not personal. 

    Why the number matters more than the excuse 

    Consider a packaging line with a case packer as the constraint. The plan for the month was 175,000 bags. Actual good output was 162,500. The gap is 12,500 bags. 

    Contribution margin on that product is $10 per bag, which is price less variable cost. Not gross margin, not revenue. Contribution margin, because the fixed cost base gets paid whether the line runs or not, so the full margin on recovered volume drops to the bottom line. 

    12,500 bags at $10 is $125,000 for the month. Annualized, that is $1.5mm on one asset. 

    That figure did not require new instrumentation, a software purchase, or a consultant. It required plan, actual, and one number from finance. 

    And here is the part worth sitting with: $1.5mm is the small number. It is the gap to a plan that was already discounted to what the line has been doing. The gap to what the asset can actually produce is considerably larger, and we will get to that. 

    Unmeasured margin never gets funded 

    This is the mechanism that keeps the money on the floor. 

    Finance cannot approve a number that does not exist. A capital committee is not hostile to reliability work, it is simply comparing proposals, and the proposal that arrives with a documented figure beats the one that arrives with a conviction. Capital flows toward the best documented problem, not the biggest one. 

    So the plant that describes its losses qualitatively competes for funding against a plant that describes them in dollars, and loses every time, regardless of which one actually has the larger opportunity. 

    Sizing the loss is not an accounting exercise you do after the improvement work. It is the first act of leadership on the problem, and it is what makes everything downstream possible. 

    What to do this week 

    Pick one asset. The one that sets the pace, where a stop stops the shipment. Pull plan against actual good output for the last eight weeks. Ask finance for contribution margin per unit, in writing, even if it is just an email. 

    Multiply the gap by the margin. Write the answer as one sentence with a dollar sign in it. 

    That sentence is a better management tool than any dashboard you will be sold this year, and it costs you fifteen minutes. 

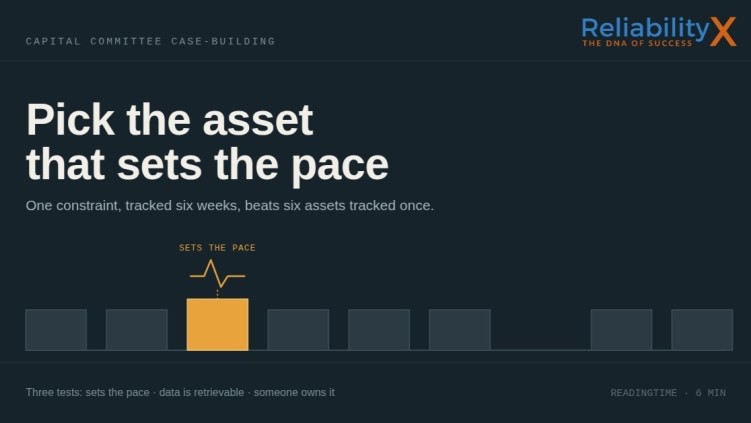
  • Pick One Asset. Just One. 

    Pick One Asset. Just One. 

    Most efforts to quantify plant losses fail in week two, and the cause is almost always the same. Somebody decides that if one asset is worth measuring, the whole line is worth measuring, and by the end of the month there are eleven partial data sets and no defensible number. 

    One asset, followed for six weeks, produces a case you can take to a capital committee. Six assets, followed for six weeks, produce a spreadsheet nobody trusts. 

    Here is how to choose the one. 

    Test 1: It sets the pace 

    When this asset stops, does the line stop and does the shipment move? 

    That is the whole test. If output upstream of the asset simply accumulates and gets processed later, you have found a busy asset, not a constraint. Recovering an hour there costs you the same effort and returns nothing to the plant, because the hour was never the limiting factor. 

    The constraint is usually obvious to the people who run the line and frequently invisible in reporting. Ask two operators and a supervisor where the line backs up. They will agree, and they will be right. 

    A caution: the constraint moves. Product mix, seasonal demand, and a maintenance backlog can all shift it. For a six week exercise, pick the asset that is the constraint most of the time and stay with it. Chasing a moving constraint week to week is how the effort dies. 

    Test 2: You can get the data 

    You need run time and output for at least eight weeks of history, plus the ability to observe the asset for two weeks going forward. 

    Perfect data is not the standard. Retrievable data is. A production log in a binder is enough. A shift handover sheet is enough. If the asset is instrumented and you can export it, that is faster, but nothing here requires it. 

    If the data does not exist in any form, that is itself a finding worth reporting, and it usually means picking a different asset for this first pass rather than starting a data collection project you will not finish. 

    Test 3: Somebody owns it 

    There has to be a named person, an operator, a planner, or a supervisor, who can actually change something about how the asset runs. 

    This is the test people skip, and it is the one that determines whether your number turns into money. An asset nobody owns produces an interesting figure, a good slide, and no change at all. When the analysis is done, someone has to be able to act on it without waiting for a reorganization. 

    Write it down and say it out loud 

    Once you have chosen, commit publicly. Tell your plant manager which asset you are following and why. Put the name in an email. 

    This sounds like a small thing. It is the difference between an exercise that survives the first busy week and one that quietly stops. Named commitments get kept. 

    Your fifteen minutes this weekend 

    1. Name the asset. 
    1. Pull plan against actual good output for the last eight weeks. 
    1. Email finance and ask for contribution margin per unit, which is price less variable cost. If they push back, that conversation is itself worth having, because a finance blessed margin figure is nearly impossible to attack later. 
    1. Multiply the eight week gap by the margin. 
    1. Write the result as one sentence. 

    You now have one asset and one dollar figure, which is more than most plants have, and it is the input for everything that follows.

  • The Power of Empowering Employees: Unlocking Potential and Driving Success

    The Power of Empowering Employees: Unlocking Potential and Driving Success

    Empowering employees is more than a management buzzword—it’s a transformative approach to leadership that benefits individuals, teams, and organizations alike. When employees feel empowered, they take ownership of their roles, embrace responsibility, and actively contribute to the success of their organization. But what does empowerment truly mean, and how can leaders create an environment where it thrives? 

    At its core, empowerment is about trust. It involves granting employees the autonomy to make decisions, solve problems, and take actions within their roles. This trust not only boosts morale but also encourages employees to innovate, challenge the status quo, and drive improvements. The result? A more engaged workforce that’s motivated to contribute at its highest potential. 

    Why Empowerment Matters 

    Empowered employees are engaged employees. Research consistently shows that engagement directly correlates with productivity, quality, and even profitability. When employees feel their ideas are valued and their efforts make a difference, they become more invested in their work. This translates to higher performance, improved customer satisfaction, and reduced turnover—a win-win for employees and employers alike. 

    Moreover, empowerment fosters a sense of ownership. Employees who are trusted to make decisions take greater pride in their work. This sense of accountability not only boosts their confidence but also encourages them to seek out opportunities for personal and professional growth. 

    Creating a Culture of Empowerment 

    Empowering employees requires more than assigning tasks and hoping for the best. It starts with leadership that is committed to fostering a supportive and trusting environment. Here are a few key strategies to cultivate empowerment: 

    • Provide Clear Expectations
      Employees need clarity to feel confident in their roles. Clear expectations about responsibilities, goals, and organizational priorities enable them to make informed decisions that align with the company’s vision. 
    • Offer Resources and Training
      Empowerment without the proper tools and knowledge can lead to frustration. Equip employees with the resources, training, and support they need to excel in their roles. 
    • Recognize and Reward Contributions
      Acknowledge employees’ efforts and celebrate their successes. Recognition reinforces positive behaviors and motivates others to take initiative. 
    • Listen and Act on Feedback
      Empowerment is a two-way street. Actively seek input from employees, value their opinions, and incorporate their feedback into decision-making processes. 

    Real Results of Empowerment 

    Consider a maintenance team where technicians are encouraged to take ownership of equipment reliability. Instead of simply following work orders, they are empowered to analyze data, propose improvements, and implement solutions. Over time, this proactive approach reduces downtime, increases efficiency, and instills a sense of pride among team members. 

    The ripple effects of empowerment extend beyond the immediate team. Empowered employees often inspire their peers, creating a culture of collaboration and continuous improvement. This collective mindset drives innovation and strengthens the organization’s competitive advantage. 

    Conclusion 

    Empowering employees isn’t just a strategy; it’s a philosophy that transforms workplaces. By trusting your team, providing them with the tools to succeed, and recognizing their contributions, you unlock potential that drives organizational success. The power of empowerment lies in its ability to create not just stronger employees, but a stronger, more resilient organization. Leaders who embrace empowerment inspire growth, innovation, and excellence at every level. 

  • Team Building: Strengthening Connections for Success

    Team Building: Strengthening Connections for Success

    The power of a strong team cannot be overstated. Teams drive innovation, solve complex problems, and deliver results that no individual could achieve alone. Yet, successful teamwork doesn’t happen by chance—it requires intentional effort through team building. 

    Team building is the art and science of creating connections, fostering collaboration, and aligning individuals toward a common goal. While it’s often associated with trust falls and icebreaker games, effective team building goes far beyond these surface-level activities. It focuses on strengthening relationships, improving communication, and establishing a shared sense of purpose. 

    Why Team Building Matters 

    At its heart, team building is about creating an environment where people feel valued, respected, and motivated to work together. A cohesive team isn’t just a group of individuals completing tasks—it’s a dynamic network of mutual support and shared accountability. 

    When teams are built intentionally, the benefits ripple throughout the organization: 

    • Enhanced Communication
      Team building activities break down communication barriers, encourage open dialogue, and help individuals understand each other’s strengths, preferences, and working styles. 
    • Stronger Collaboration
      Trust and mutual respect are the foundation of collaboration. When team members feel connected, they’re more likely to share ideas, take risks, and support one another in achieving common goals. 
    • Higher Morale and Engagement
      A team that works well together creates a positive work environment. This sense of camaraderie boosts morale, fosters engagement, and reduces turnover. 
    • Improved Problem-Solving
      Teams that trust one another are more willing to share ideas and work through challenges together, enabling them to address issues creatively and effectively. 

    Strategies for Effective Team Building 

    Building a high-performing team doesn’t require extravagant retreats or elaborate exercises. Instead, it’s about creating meaningful opportunities for connection and collaboration. Here are some practical strategies: 

    • Celebrate Successes
      Recognizing team achievements, no matter how small, reinforces positive behaviors and builds a sense of pride and unity. 
    • Invest in Development
      Providing opportunities for skill-building, both individually and collectively, equips teams to handle challenges with confidence and resilience. 

    The Ripple Effect of Team Building 

    Imagine a manufacturing maintenance team that operates like a well-oiled machine. Through targeted team building efforts, technicians feel empowered to share knowledge, collaborate on solutions, and trust one another’s expertise. Downtime is minimized, efficiency improves, and morale soars. 

    The power of team building lies in its ability to transform groups of individuals into unified, high-performing teams. These teams don’t just achieve results—they create a culture of excellence that drives the entire organization forward. 

    Conclusion 

    Team building is more than an occasional activity; it’s an ongoing commitment to fostering connection and collaboration. By investing in the growth and cohesion of your team, you unlock potential that benefits not only the individuals involved but the organization as a whole. Strong teams are the foundation of success, and intentional team building is the key to making it happen. 

  • Decision Making: Shaping Success Through Choice 

    Decision Making: Shaping Success Through Choice 

    Decision-making is one of the most powerful tools at a leader’s disposal. Whether it’s determining strategic priorities, allocating resources, or solving day-to-day challenges, the ability to make informed and timely decisions can mean the difference between success and failure. It is a skill that shapes the trajectory of teams, organizations, and even industries. 

    At its core, decision-making isn’t just about choosing between options—it’s about understanding the impact of those choices, balancing risks and rewards, and taking responsibility for the outcomes. Strong decision-making builds trust, drives progress, and creates clarity, all of which are essential in today’s fast-paced and competitive business landscape.

    Decision-making is a key leadership skill that drives success, fosters innovation, and builds trust. Learn how structured decision-making can shape outcomes and propel teams forward. 

    Why Decision-Making Matters 

    Good decision-making ensures that organizations stay aligned with their goals, remain adaptable to change, and continuously improve. Here are some key reasons why decision-making is so impactful: 

    • Provides Direction
      Decisions set the course for action. Without them, teams can become stagnant, uncertain, or misaligned. Leaders who make confident and clear decisions provide their teams with the direction needed to move forward. 
    • Drives Efficiency
      Delayed decisions lead to wasted time and missed opportunities. A strong decision-making process streamlines operations, reduces inefficiencies, and ensures that resources are used effectively. 
    • Builds Trust
      Teams respect leaders who can evaluate situations, make choices, and take responsibility for their decisions. This trust fosters a collaborative environment where individuals feel empowered to contribute their best. 
    • Facilitates Growth and Innovation
      Decisions often require taking calculated risks. Leaders who embrace decision-making as a growth tool encourage innovation, experimentation, and the pursuit of excellence. 

    The Decision-Making Process 

    Effective decision-making doesn’t happen by chance; it requires a structured approach. Consider these steps to refine your decision-making skills: 

    • Define the Problem
      Clearly identify the issue at hand. Ambiguity leads to poor decisions, so ensure the scope of the problem is well understood. 
    • Gather Information
      Collect relevant data and perspectives. This includes understanding the context, analyzing past outcomes, and considering the needs of stakeholders. 
    • Evaluate Options
      Weigh the pros and cons of each possible course of action. Identify potential risks and benefits, keeping organizational goals in mind. 
    • Make the Decision
      Avoid overanalyzing. While it’s important to be thorough, indecision can be more damaging than a wrong decision. Commit to a choice and move forward. 
    • Communicate and Implement
      Share the decision with those it affects. Clear communication ensures alignment and builds confidence in the chosen path. 
    • Review and Learn
      Reflect on the outcome of the decision. What went well? What could be improved? This analysis strengthens future decision-making. 

    Example: Decision-Making in Action 

    Imagine a manufacturing leader faced with consistent equipment downtime. By assessing the problem, gathering input from maintenance teams, and analyzing equipment data, they decide to invest in predictive maintenance tools. The decision reduces downtime, boosts productivity, and aligns with long-term operational goals. 

    Conclusion 

    The power of decision-making lies in its ability to drive progress, build trust, and achieve results. Strong strategic decision-making creates clarity in chaos and empowers teams to act confidently. By embracing the process of making informed and timely choices, leaders position themselves and their organizations for sustained success.