George Williams, CEO of ReliabilityX, explains The Bathtub Curve and PF Curve.
Category: Maintenance Management
-
Reactive vs Proactive
George Williams, CEO of ReliabilityX, explains the difference between reactive maintenance vs proactive maintenance.
-

Certification and Competencies
Competency is defined as the capability to apply or use the set of related knowledge, skills, and abilities required to successfully perform a task or work safely and consistently to a required standard. Simply stated, Competency is a critical skill set needed to do a job successfully. On the other hand, Certifications are designated credentials earned by an individual or organization to verify their legitimacy and competence to perform a job or produce something in a stated environment. Certification is typically displayed as a document stating that you have acquired appropriate knowledge, been trained, and are prepared to meet a specific set of criteria as a professional. This certification is awarded only after you’ve passed the proper assessments administered by a recognized third-party credentialing institution or organization. Generally speaking, there are three general types of certification: Organization -internal, Product-specific, and Profession-wide, such as reliability and maintenance professional. Some examples of professional certifications are CMRP, CMRT, CRL, CMM, MLT, CAMA, etc.
Professional certification is not a replacement for accredited degree work but instead is supposed to complement your education or professional experience in your field. Once you’ve earned a certification, you are given a designation that you can use after your name as a way to distinguish certified professionals. Obtaining professional certification displays your dedication to your profession and verifies that you’re well-trained to use your industry’s best practices and tools effectively. Taking the time and effort to obtain these certifications can show potential employers that you are a valuable contributor to your profession and help you gain recognition for your commitment to continuous learning and self-improvement.
The significant advantages of becoming certified in your work include:
- Knowledge and skills to implement best practices
- Professional credibility
- Improved Efficiency
- Competitive advantage
- Improved earning potential
If you have any questions on this topic or others, please fill out the form below or get in touch with us at ReliabilityX!
-

CMMS Principles for Success
First published in Plant Services August 2020.
Arguably, at the cornerstone of any sound asset management, reliability, or maintenance strategy is the Computerized Maintenance Management System (CMMS). From selection to setup and utilization through data analysis and continuous improvement, your CMMS plays a major role in your success in maintenance and reliability. As such, a poorly designed CMMS implementation can be a major inhibitor to achieving success. Over the years I have been fortunate enough to gain some experience in the arena. Some of those experiences have gone extremely well. Others have taught me lessons in what not to do a second time.
Let us look at some principles for implementation and utilization success. When you are finished reading this, and the rest of the amazing content in Plant Services, I encourage you to drop this on the desk of others who may need it. Or, better yet, send them a subscription.
Implementation Principle One: Do not be in a hurry when it comes to selection
Manufacturing operations have literally hundreds of CMMS options to choose from. The ultimate decision may have lasting effects, as you will likely be with this system a minimum of five years. Considering the additional work involved in migrating from one system to another, your company is likely to stick with this decision unless it encounters serious issues with the legacy system.
The overall selection process should include a Request for Information (RFI), where you ask general questions regarding functionality to ensure only vendors who can meet your needs move along the selection path. Questions within the RFI should be written clearly, such as, “Does your solution have out of the box functionality to automatically generate PM work orders based on meter reading inputs that hit an action limit set by user?” For each question within the RFI, the vendor should be directed to expand on the answer. Stay away from vendors who simply provide Yes/No answers. RFI responses should be scored to develop a shortlist of vendors who will provide demonstrations of their systems.
Create a scripted demonstration for your potential vendors to follow as part of their demos. What does this mean? Do not rely on their demos alone. They will likely demonstrate using previously created records, which does not help you truly understand how user friendly the system is. Below is a sample basic script. Be sure your script touches on areas that you are interested in, which may include reporting capabilities.
- Create a location record (if system uses location records).
- Create an asset/equipment record assigned to a location from step one.
- Create an inventory record.
- Create a basic job plan with two tasks and assign the inventory record from step three.
- Create a PM record for an asset/equipment from step two and assign the job plan from step four.
- Generate the PM work order and show the inventory record reservation.
- Assign the work order and walk through to completion with the steps.
Implementation Principle Two: Know your needs
Management may expect you to use the capabilities that exist within an existing ERP system. Ensure the functionality meets your needs, helping you to see value and make business decisions. Evaluate the existing ERPs capability in this space as you would when selecting any other system. Remember, just because you can put a table in a Word document does not mean you can do without Excel. You need a system that can deliver results. A list of user requirements will help ensure results..
A User Requirement Specification (URS) contains the needs of the business – what capabilities must exist or what information should be required on different record types. While this may need some revisions based on the system you ultimately choose, it is recommended to have a URS before final vendor selection. Also, vendors can use the URS to help develop the statement of work and provide a more accurate estimate of costs.
Implementation Principle Three: Take advantage of the opportunity
An upgrade or change of CMMS provides a great opportunity to improve data quality and processes associated with work execution. Take advantage of this. Ensure your equipment hierarchy is accurate, fix naming and numbering conventions, and standardize value lists. Taking the time to ensure data quality will pay dividends throughout the lifecycle of the new system.
In addition to data quality, an upgrade or new CMMS implementation is also a great time to assess best practice processes for managing maintenance work. Ensure the new system contains enough work order statuses to align to your business process. A good rule of thumb is this: each status should be owned by only one role in the maintenance org chart. The maintenance manager should know exactly who to call by a work order’s status. If in “Planning,” call the planner. If in “Awaiting Materials,” call the storeroom. Each role may have multiple statuses, but each status should belong to only one role.
Implementation Principle Four: Standardize what should be standardized
This is particularly important if you have multiple locations. Value lists such as statuses, equipment classes, or priorities should be standardized to ensure clean data reporting. Equally important will be decisions such as using smart numbers or auto numbers for records. My recommendation is to avoid smart numbers wherever possible. Inevitably they lead to being forced to modify the logic to accommodate what was not thought of before or due to exceeding character limits.
Implementation Principle Five: If you want it, require it
Data quality will have a direct impact on your reporting, performance tracking, and deeper data analysis. If you expect downtime to be tracked for breakdown maintenance, require it. If you need failure reporting to be utilized, require it. Assurance of available data will provide greater datapoints and should improve accuracy.
There are two methods for data requirements: system enforced required fields and process enforced required fields. Clearly, system enforced required fields ensure the data will exist. However, some systems lack the ability to do this conditionally. For instance, if you want only corrective orders to have failure codes, but the CMMS you have chosen does not provide that capability, you may be forced to acquire the data through process. While less accurate, you can use reporting methods to monitor this behavior until it is instilled in the organization. Develop a report to track percentage of corrective orders with failure codes and a detailed report by technicians, so you can coach those who may need to improve.
Utilization Principle One: Training, Training, Training
Probably the most critical step in ensuring CMMS success will be training. Carefully consider several factors here, such as the length of training for each user role, how training will be delivered, and what additional resources should be available to users after training.
In person or virtual live training should be role based to ensure users are not required to sit through functional learnings they will not use. Training, where possible, should allow users to do live training in a replicated environment. Watching the instructor use the system will have limited success.
Online training modules where users must enter information and follow along are effective for step by step instruction but do not allow for questions or deeper dives into functional capabilities. It is recommended to use online training modules as refresher or online help.
Utilization Principle Two: Listen to the users
Feedback on functional capabilities, points of frustration, and/or system glitches should be considered critical. Although you may not be able to deliver all of the functional capabilities users may request, getting a handle on their needs will provide the basis for either business process changes, system changes, or even tickets back to CMMS vendor if the system is not performing as designed. When users provide feedback be sure to communicate the status and where the request sits in the priority list. If requests are, seemingly, ignored, users will stop providing feedback. While this may lighten the load, it will not continually improve your CMMS utilization.
Utilization Principle Three: Do not skimp on system administration
Another huge point of failure in CMMS utilization is a fundamental lack of understanding when considering the volume of administrative work to keep the system clean. From work orders, inventory, PMs, task lists, and equipment records, someone needs to keep it all together. Consider this scenario: if when replacing a pump the equipment record is not decommissioned and a new equipment record created, all of the costs associated with the replaced pump will be included in the new pumps lifecycle cost.
From cycle counting to equipment replacements, it’s important to ensure that the system you have spent a significant amount of money on stays clean. Over time, an unmanaged system will become frustrating for users as they weed through records that should no longer exist or cannot find records that should exist. A disorganized system is one that will lack utilization.
Utilization Principle Four: All work must be a work order
Let’s face it, this is probably one of the more difficult principles to achieve. It’s also the most important. The CMMS should be much more than a filing cabinet. It doesn’t exist only to remind us to do PMs or issue parts. At its core, the CMMS is designed to provide information to help manage assets. This includes an understanding of costs, reliability, MTTR, and many other points of data for analysis. Unless all work is accounted for, the data is skewed. If technicians are tapped on the shoulder to perform work and a work order is not generated, the data is lost. In my estimation and based on years of teaching both planning and scheduling and CMMS utilization, the average organization accounts for about 40% of technician time within the CMMS. If this is true, the data used for analysis is lacking substantially.
Let’s consider a common analysis within the CMMS, such as top 10 lists for cost and reactivity. You pull the data and see which assets are costing the most and which are the most reactive on-site. You take this information to the engineering department and ask to have these assets put on the capital plan for replacement. Sounds like a good strategy. Except the data could be significantly different if all the work was accounted for. I recall, when working for a previous employer, who expanded the cafeteria and added 27 drains to an existing system without increasing the grease trap size or main drain size. We went from spending minimal time maintaining the system yearly to literally having to chop up grease in the lift station because it was passing the trap. We were able to prove a yearly cost increase of $25K, go back to engineering with this information, and justify the spend to increase the trap to adequate sizing. We would not have been able to win the battle if we did not account for our work. All other data in the CMMS is inaccurate if you are not accounting for all work.
Utilization Principle Five: Track all costs
A step further than just accounting for the work is accounting for all costs. Costs associated with a technician’s time is common. Parts costs are also common, but sometimes lacking if the use of P-Cards is allowed or too frequent. Less common is capturing service related PM and repair work, equipment rentals, and vendor costs associated with collecting condition monitoring points. Learn how your CMMS can help track these costs. Commonly, a service requisition (similar to a parts requisition) can be generated with a PO issued and assigned to one or more assets. Work orders generated against the PO, when closed, act like parts receipts allowing invoicing to go against the PO and costs to be assigned to the equipment. This works for many CMMS solutions and for service contracts as well.
Tracking all costs will allow for more accurate lifecycle costing models and help integrate into your capital replacement strategy. Getting to this level will allow you to flex your CMMS muscle and have a more respected seat at the table when it comes to capital planning.
Hopefully, these principals for CMMS implementation and utilization help guide you as you continue your journey toward reliability sustainability. For more information contact me at ask@reliabilityx.com
Use the comments section on the web version of this article to provide your feedback on additional principles that should be included in this list. We would love to hear your feedback.
-
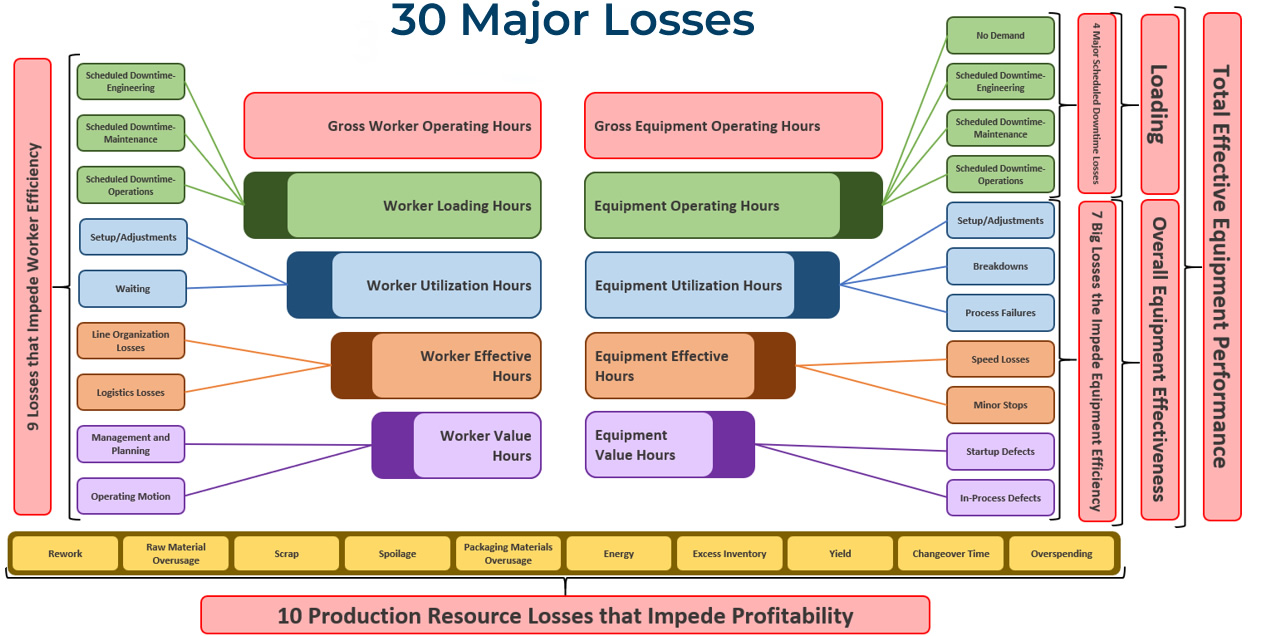
Understanding Plant Losses
The Way Losses are Calculated
and OEE/TEEP CalculationIn order to get a broad, clear picture of where to focus, you have to view your whole plant as a large system of fully manageable processes. No matter your role, your job is to improve plant processes, helping to produce the highest quality product, at the lowest price possible, in the safest manner. In order to see this big picture, you have to be honest and expose true problems within your facility. From that perspective, you will be able to recognize the different types of losses in your plant and how to secure significant gains in productivity by controlling those losses.
How to determine where to focus
The examples in this article use weekly numbers, but the same analysis can and should also be applied monthly, quarterly, and annually. Here we will look at how we apply metrics to some of the different loss types. Armed with an understanding of how your plant is losing productivity and how to measure those losses, you can effectively increase profitability. Let’s look at a few areas of loss.
Available Time To Produce (Loading)
- First, you figure all scheduled downtime. Remember your buckets and put time scheduled in each of the buckets: Changeovers, Engineering Planned Shutdown, Maintenance Planned Shutdown, Operations Planned Shutdown, or No Customer Orders.
- Add them all together to come up with your Scheduled Downtime.
- Then subtract that from total hours in a week (168 hours available).
Example: (Planned Maintenance of 24 hours) + (Changeovers of 4 hours) = 28 hours of scheduled downtime.
(168 hours in a week) – (28 hours Scheduled Downtime) = 140 hours available to produce.Loading Calculation: (140 scheduled production hours) / (168 hours in a week) = 83%
This gives you your Available Time To Produce, 140 hours per week or 83%.
Quality Rate
Start by taking your startup rejects and your in-process rejects, add them together, then subtract that value from your total units produced.
Example: (35 Startup Rejects) + (35 In-Process Rejects) = 70 Rejects.
7,070 Total Units Produced.
7,070 – 70 = 7,000 Good Units Produced.Quality Rate Calculation: (Good Units Produced) / (Total Units Produced) or 7,000 / 7,070 = 99%
Net Good Processing Hours
Find your Net Good Processing Hours by dividing your Average Weekly Throughput by your Weekly Design Rate.
Example: Average Weekly Rate is 7,000 units produced.
Weekly Design Rate is 100 units per hour.
7,000 / 100 = 70 Net Good Processing Hours.
Then, divide your Net Good Processing Hours by your Available Time To Produce.
Example: Available Time To Produce is 140 hours weekly.
70 Net Good Processing Hours / 140 Available Hours To Produce = 50%Net Good Processing Hours Calculation: (Average Weekly Rate) / (Weekly Design Rate)
That is, (Weekly Units Produced) / (Weekly Design Units per Hour)Availability
Begin by taking your Average Breakdown Downtime, Process Failure Downtime and Set/Adjustment Downtime, adding them together, then subtracting the total from the Available Time To Produce.
Example: (13 hours of Breakdowns) + (1 hour of Process Failures) + (1 hour of Setup/Adjustment) = 15 hours downtime
(140 hours Available Time To Produce) – (15 hours Downtime) = 125 hours Availability per week
Availability Calculation: (125 hours Availability) / (140 hours Available Time To Produce) = 89% Availability
Performance
First, take your Actual Weekly Run Rate and subtract it from the Weekly Design Rate.
Example: (Weekly Design Rate of 100 per hour) – (Actual Weekly Run Rate of 85 per hour) = 15 units per hour lost.
To convert that loss to hours, divide the Actual Weekly Run Rate by the Weekly Design Rate, subtract that quotient from 100, then multiply that difference by the Availability (in hours per week).
Example: ( 100 – (Actual Weekly Run Rate) / (Weekly Design Rate) ) x (Weekly Availability)
( 100 – (85 units/hr / 100 units/hr) ) x (125 hours available to produce) = 19 hours in speed lossesNow, subtract the hours in Speed Losses from the Weekly Availability hours to get Available Time To Produce.
Example: (125 hours Weekly Availability) – (19 hours in Speed Losses) = 106 hours Available Time To Produce.
To find minor stops, subtract your Net Good Processing Hours from your Available Time To Produce.
Example: (106 hours Available Time To Produce) – (70 hours Net Good Processing Hours) = 36 hours of minor stops per week.
Performance Calculation: (Speed Losses + Minor Stops) / Weekly Availability
(19 hours in Speed Losses + 36 hours in Minor Stops) / (125 hours Weekly Availabilty)
(19 + 36) / 125 = 56% PerformanceOEE/TEEP Calculations: OEE = Availability * Performance * Quality
OEE = 89% * 56% * 99% = 49%
TEEP = Loading * OEE (Loading = Percentage Available Time To Produce)
TEEP = 83% * 49% = 41%7 Big Losses: Minor Stops: 36 hours per week
Speed Losses: 19 hours per week
Breakdowns: 14 hours per week
Process Failures: 1 hour per week
Setup/Adjustment Losses: 1 hour per week
Quality Startup Losses: 0.5 hour per week
Quality In-Process Losses: 0.5 hour per weekIf these were your numbers, where would you focus?
-

Why Do We Not Want Help?
In many dealings throughout my career, including myself, it seems common place that people do not want to admit the need for help. From physically, mentally, in life, or in business, our ego’s seem to always keep us from reaching our full potential.
As It Relates to Business
When it comes to business world, why do we allow ego to kill our businesses? Truly successful people understand their need for help. They understand what their gaps are and the need to use others to close them. Outside help is the help that is normally needed. If the organization had the internal knowledge and skills, they would have driven the needed improvements. The exception is if you have superstars that you know are some of the best in the industry working for you already, but you have pushed them to the side, maybe you need to unleash them on the organization. In my opinion, there are three main reasons as to why people do not ask for help and/or any combination of the three.
Ego
9 times out of 10 the cause of ego is due to a lack of knowledge. People with ego believe that they know more than they actually do, which creates an overconfidence in their abilities. Einstein’s Theory of Knowledge states that Ego = 1/knowledge. In other words, the more knowledge you have, the more you realize you do not know, thus, less ego.
Fear
Fear normally ties to ego. It is the fear of looking incompetent due to the lack of knowledge which would drive the need for help but is refused. People fear looking like they cannot do a certain task or job. It makes them fell inferior and that is not a feeling that people like to experience. Great leaders understand that they need the help, which is why they are successful.
Cost
To understand the cost of help, most people look at this backwards. They look at bringing in help as an expense, not an investment. For example, if I were contracted to do work for $100k, people look at the $100k and say that it is expensive. What if you looked at it as an investment, understand that you will provide a return much greater to the organization. If I were to help you resolve issues that are troubling your organization, it is possible to get a 10 to 50 time’s investment or even more! The best of all is the fact that you are now the hero.
My Growth
My growth took off exponentially when I realized I did not know everything and I reached out for help. I spent many years thinking that I was the best, and I was, at managing the reactive state of maintenance. I had no concept of proactive maintenance. I just knew that my job was to keep the plant running, and I did just that. Working 20 hour days was my responsibility.
The Defining Moment
One day, as we were working on the implementation of a CMMS system, I met a gentlemen that told me everything that I was doing was of truly no benefit. He sat me down and walked through some of the things I should have been doing and what I should not have been doing. He told me what I needed to hear, not what I wanted to hear. In my current state of immaturity, it made me mad, but I also new that he was only trying to help me. I told him I wanted to be the best, so if he could help me than I am all ears. He did just that. He loaded me down with books, answered my questions, and taught me things that I had no clue about. It began to open my eyes of this larger world that exists, and that is when I realized that I did not know anything, compared to what I thought I knew. From that point forward I began hiring anyone from the outside that I could to help me overcome my gaps, my weaknesses and help develop my strengths.
Question
What are some reasons as to why we think we do not need help?
-
Why the Maintenance Deficiency?
The awareness gap results from management having limited or no knowledge of the maintenance function and its ability to contribute to the manufacturing process; and maintenance personnel, managers included, having limited understanding of the business side of manufacturing. The result is that management and maintenance are often unsure how they together contribute to the company’s success.
Your Company’s Maintenance Attitude
When I ask managers or hourly workers what their organization’s perception of maintenance is, I tend to get the same types of responses. I hear things like:
- Maintenance is a cost center
- Maintenance is a necessary evil
- Maintenance is the cost of doing business
- Maintenance personnel are firefighters
When asked to define maintenance, they offer words such as fix, restore, replace, recondition, patch and rebuild. I’d say these are reactive definitions of the word. What is maintenance? Maintenance is to maintain or the act of maintaining. The basis for maintaining is to keep something in a specific state or condition – that is, to keep it (the asset, in our case) in an existing state or preserve it from failure or decline. There is a world of difference between this definition and the words and functions normally recalled by most people who are “knowledgeable” about the maintenance function. The best way to change the perspective is to show the entire organization how it is that maintenance provides value. To keep things simple here, let’s focus on three types of value: convenience, process improvement, and financial value.
- Convenience is sold through a demonstrated or statistical approach to prove that a plant will be safer and will produce higher-quality product, resulting in less rework. Greater production efficiency means lower costs; lower costs gives us marketing advantage; marketing advantage and enhanced competitiveness can promote job security. You empower people to do what they know to do by providing the proper tools and removing obstacles to their getting it done.
- Process improvement is sold through less downtime. This means running to plan, which makes the production manager look like a superhero. Better asset use improves capacity, which means more volume, more profit, and more recognition. Also, less downtime results in less frustration, raising morale and helping to drive culture change.
- Financial value is sold through the freeing of cash flow, reduced costs, and higher profits. These all translate into two things: higher stock value and more capital for reinvestment into the company.